Matlab-like
Plotting library for Scilab
The Plotlib is distributed under the GNU General Public License.
You can directly install the Plotlib from inside Scilab by using the ATOMS package manager of Scilab, by typing the command
--> atomsInstall plotlib
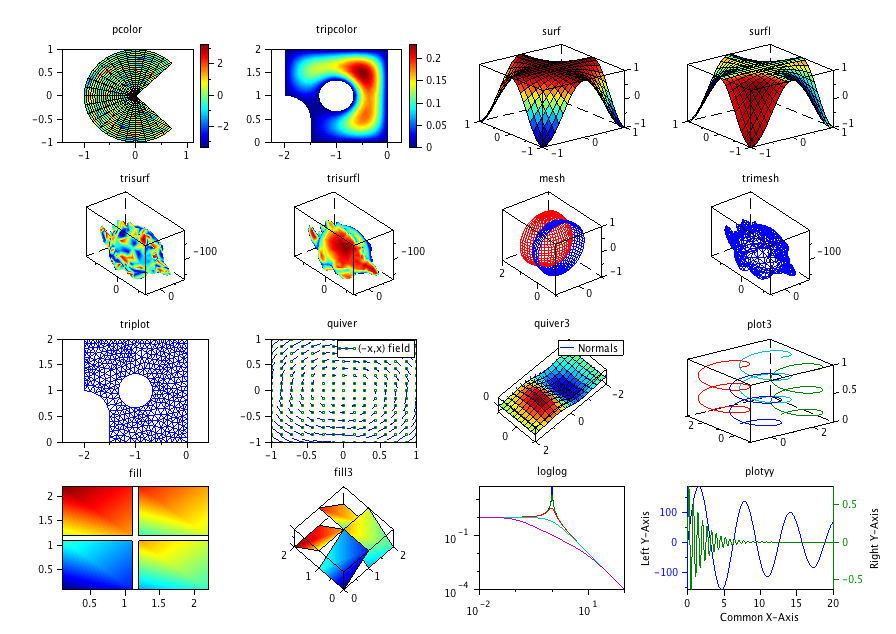
Since the 0.4 version, the plotlib gives further compatibility with Matlab graphics. See the 0.4 help files and the screenshots. The sources can be found on the Scilab forge.
|
Don't forget to checkout the homepage of the XMLlab project, at XMLlab is a simulation authoring environment using XML and Scilab (and also the Plotlib …). |
Version history
Version 0.44 Lun 28 jan 2013 09:54:21 CET
Fixes to improve the compatibility of the plotlib with the Atoms and Demo GUI.
Version 0.43 Jeu 27 sep 2012 09:19:14 CEST
plotlib macros dont have an underscore anymore. Better cohabitation with original scilab graphics. Default white background
Version 0.42 Mar 18 mai 2010 18:45:30 CEST
New macros : image, imagesc, bug corrections (trisurf)
Version 0.41 Ven 19 mar 2010 16:48:20 CEST
Modern toolbox packaging to be Atoms-compatible.
Now the call to plotlibmode should be in the user's .scilab.
Added a plotlib demo in the Scilab's demo menu.
Added the possibility of setting default properties thru the 0 handle :
set(0,'defaultfigurecolor',[1 1 1]);
works for any property that actually makes sense for
the given object (for the moment Axes or Figure).
Version 0.4 (Jeu 18 mar 2010 09:23:35 CET)
Many improvements :
A Plotlib graphic handle is now a Scilab native graphic handle encapsulated in a mlist of type "pltlibH". By using the overloading features of Scilab, these two kinds of handles can be read or changed transparently by using the set and get macros. The native Scilab graphic properties of the encapsulated handle are also transparently read or changed by these two macros.
The default display function %pltlibH_p for plotlib handles just gives the Type of the handle. To display and/or get a single property, you can use the get function or the . field operator. Idem for the set operation :
h=surfl()
z=get(h,'ZData');
z=h.ZData;
set(h,'CData',z);
h.CData=rand(z);
You can get more than one property value at a time, by using a vector of strings, or get all properties by omitting the property. In both cases, get returns a struct with corresponding fieldnames.
h=pcolor()
get(h,['FaceColor','EdgeColor'])
get(h)
See the Plotlib help "Matlab-Like Plotting Library" chapter in Scilab help menu.
Version 0.3
Revamped all the internal data fluxes. Adopted the Matlab system for the axes and leaf entities. Many properties implemented.
Doc to be updated.
Users of svn can stay in tune with the following url
svn://marguerite.lmac.utc.fr/usr/local/svnrepos/xmllab/trunk/XMLlab/noarch/plotlib
Version 0.21
Second draft with english help files in xml. For Scilab < 5 the old plain text help files are used.
Version 0.2
First draft of the plotlib working with the new graphics
Version 0.198
Idem with the Pos driver.
Version 0.197
Improvements to allow the complete use of the plotlib with the GIF and PPM driver. Be aware that with theses drivers there is no multi-window manadgement. The recommended version of Scilab is Scilab 4.1.
Example :
driver GIF
xinit graph.gif
subplot(2,2,1); trisurfl;
subplot(2,2,2); pcolor;
subplot(2,2,3); trimesh;
subplot(2,2,4); loglog; title('loglog plot')
xend
Version 0.196
Slight changes for Scilab 4.0 compatibility.
Version 0.195
Added new properties :
'ticksX','on|off|none'
'ticksY','on|off|none'
in 2d plots : used to turn on or off the ticks and ticks labels on X and Y axis.
Version 0.194
Added a new function:
bar : draws vertical bargraph. Type help bar to see usage and examples.
Changed the plotlib0nnn-install folder to "plotlib" (will keep this for future versions also). The version number can be found as usual in the file macros/VERSION.
Version 0.193
Fixed a problem with font size calculation by the function xstringl with Helvetica font under windows. Update of the README file to explain the new location of the .scilab startup file since Scilab-3.1-rc1.
Version 0.192
Implement some changes initially devoted to the future 0.2 release. The plotlib still uses the Old graphics mode.
1-Better legends (labels remain centered when resizing the window, and spacing is better computed).
2-A new low level function for better Matlab compatibility
fill(X,Y,C)
draw some 2D polygons arranged in columns : i'th polygon has coordinates X(:,i),Y(:,i) and color(s) C(i) or C(:,i) if each vertex has a color (to do e.g. interpolated shading).
3-New properties related to shading (2D and 3D) but you can now use the following properties/values :
'facecolor','flat'
'facecolor','interp'
-> changes the shading type but does not change the edgecolor. You can now have interpolated shading+edges (type trisurfl for an example).
The 'shading','interp' property/value pair is still valid and is equivalent to
'facecolor','interp','edgecolor','none'
The 'shading','faceted' property/value pair is still OK and is equivalent to
'facecolor','flat'
The 'shading','flat' property/value pair is still valid and is equivalent to
'facecolor','flat','edgecolor','none'
4-Other properties related to shading (3D)
For macros : surf,trisurf,surfl,trisurfl
'backfacecolor',[r,g,b] -> the backfaces are painted with color [r,g,b]
'backfacecolor','none' -> the backfaces have the same color as the front
faces
'backfaceculling','yes|no' -> backfaces are not painted
For macros : surfl,trisurfl
'backfacelighting','lit' -> equivalent to 'backfacecolor','none'
'backfacelighting','unlit' -> equivalent to 'backfacecolor',[r,g,b]
where [r,g,b] is the "mean" color of the RGB colormap.
5-Other changes
New 'jet' value for the colormap property/function
"colormap jet"
Version 0.191
Slight modifications for XMLlab
Version 0.19
Small changes to fit to the now default "new" figure style (old figure style is selected in loader.sce).
Version 0.18b1 (6/3/2003)
New installation system, with the two scilab scripts
builder.sce/loader.sce (see the README file)
Version 0.17 (18/7/2002)
Bug fixes, and some new features (see the homepage)
Version 0.17b3 (20/02/2002)
A few bug fixes (see the homepage).
Version 0.17b2
A few bug fixes (see the BUGS files)
Better error handling in the generation of the library. Now the 'plotlib' variable, if it exists, is unprotected and then cleared before the call to 'genlib'.
Version 0.17b1 (Thu Mar 15 15:57:47 CET 2001)
This version uses many of the new features of Scilab 2.6.
The state will remain 'beta' until the documentation will be ready...
MAJOR ISSUES
- New colorbar positions (left, right, top, bottom (or bot))
- plot(x,f) where f is a function with the syntax y=f(x)
or [x,y]=f(t);
- New values for the color/marker string in 2D plots :
the strings '--' and '-.', which can be combinated with other usuals characters, allow to make respectively dahsed and dash-dot curves. Same behavior for plot3 (curves in 3D).
- New 'axis' property values in 3D functions (plot3,mesh, surf, ...) :
* 'equal (isometric plot)
* 'vis3d' (isometric/non expanded plot)
* 'box' (only the box without captions)
* 'trihedral' (only the 3 small x/y/z axis)
- New allowed values for the 'view' property. When you specify
'view',V
if V is a 2 x N matrix, then the graph is being represented
successively for the view points V(:,i), i=1:N.
- New 'axis' property values in 2D plot functions (plot, pcolor, tripcolor)
* 'left' (the y axis is displayed on the left)
* 'right' (the y axis is displayed on the right)
* 'center' (the x and y axis cross at the center of the plot box)
* 'origin' (the x and y axis cross at the (0,0) point
- New property for 2D plots 'grid', with the possible values
* 'on' or 'off'
* a 3-vector giving the color in RGB coordinates.
- Support of list arguments in plot, mesh, ... Example :
--> myOptions=list('background',[0 0 1],'axis','equal');
--> t=0:10; plot(t,sin(t),myOptions)
the list is expanded while the argument list is parsed, so that the above line is equivalent to
--> t=0:10; plot(t,sin(t),'background',[0 0 1],'axis','equal')
MINOR ISSUES
- Now the 'xlabel', 'ylabel' and 'title' can be used as properties in 2D plot functions. The 'title' property can be used in 3D functions also.
- The font size used for tick labeling and labels now depends on the window size (it already depended on the subplot state).
Version 0.16 (2000/12/17) bug fixes
Essentially bug fixes (installation under Windows and pb with colormaps, see the BUGS file)
Version 0.15 (2000/7/7) new functions + man pages
New functions :
- pcolor() and tripcolor() : pseudo-color 2D
plot of rectangular or non-rectangular or triangulation-based patches. These new function will support interpolated shading with the next version of Scilab
- whitebg() : to set the default color scheme of figures. This function existed for a while, but was not documented in the man pages (now it is).
- caxis() : to set the color scale of pseudocolor plots
- colormap() : to set the colormap of pseudocolor plots. Was mentionned in the man list but the man page was absent (this has been fixed)
various Improvements :
- the man pages for trimesh/trisurf/trisurfl has been improved. Now calls like trimesh() produce a demo plot, where the data are loaded from the file
SCI/macros/plotlib/tridem.dat
- A few bugs fixes
Version 0.14 (2000/5/18) automated installation
Automated installation via script files.
Version 0.13 (04/05/2000) support for interpolated shading
- Added the property "hidden" for the mesh macro
The possible values are 'on' and 'off'. This allows to do fast wire frame rendering
- Added support for the modified version of plot3d1 (interpolated shading) In the macros surf, surfl, trisurf,the property 'shading' can now take the value 'interp'. If your version of plot3d1 does not support interpolated shading then an error message is given (should it be a warning ?).
To allow interpolated shading in plot3d1, you need to recompile scilab by patching some files :
SCI/interf/matdes.f
SCI/routines/graphics/Plo3d.c
SCI/routines/graphics/Rec.c
SCI/routines/graphics/RecLoad.c
SCI/routines/graphics/RecSave.c
The patched/enhanced files can be find at the URL
http://www.dma.utc.fr/~mottelet/plotlib-related/patches
All the added code is driver-independent and so the modifications apply for any driver (X11, Pos, Xfig, GIF, ...). For those who are familiar with the source, all the modification are quoted and well commented (to find the modified stuff, look for the string "polpoth" -that's my nickname- in the above mentioned files).
The code is not optimal, but the rendering speed is more than correct, compared to what could have been done with a sci macro.
Version 0.12 (04/02/2000) support for triangular mesh
- Added 3 new functions, for plotting surfaces based on a triangulation : trimesh, trisurf and trisurfl. The syntax is like in Matlab, and all the property/value settings are the same as for mesh, surf and surfl.
Version 0.11 (01/13/2000)
- I added 'xlabel', 'ylabel ' and 'zlabel' properties for surf, mesh, surf and plot3d.
Version 0.1 (10/14/99) : a bunch of new stuff
- Many rewriting and bug fixes, a big effort on documentation (help .cat files). Now each function is in a separate .sci file. The new release makes use of global variables so you have to upgrade to scilab 2.5
- New functions (now some help can be obtained for all functions)
legend() (for 2D plots)
xlabel(), ylabel(), title()
3D enhanced functions :
plot3(), mesh(), surf(), surfl()
with the classical Matlab syntax, and with the possibility of giving the surface values by a function (type help mesh).
'colorbar' (a property name for the above functions)
colormap()
to change the colormap of 3D plots.
Version 0.05 (04/22/99) : new functions
- I have added some functions to make plots with a log scale
semilogx()
semilogy()
loglog()
The syntax is the same as the function plot() i.e. try the commands
w=logspace(-1,2,500);
s=%i*w;
g=1../(s+1); g2=1../s;
loglog(w,abs(g),w,abs(g2))
- I have also added the function
gcf()
which returns the number of the current active window.
Version 0.04 (03/30/99) : new functions
- I have added a hold() function. Can be used with the arguments `on' or 'off' like this
hold on
hold off
or without arguments
hold()
in this case the hold state toggles between on and off.
- xlabel(string)
Puts a label below the X - axis. You may wonder why I did not do something for the Y - axis : the problem is that the angle modifications which are posssible in the xstring macro affect *each* character, and not the whole string ! The result is unreadable (to me). Until now, I dit not find a solution.
- axis()
This function in only callable without arguments. The call
vect=axis()
returns the current axis limits with the Matlab convention i.e.
vect=[xmin xmax ymin ymax]
Version 0.03 (03/24/99) : some crucial ameliorations (printing)
- The printing problem has been fixed. Now printing and exporting in b/w mode produces correct results.
- Pretty axis graduations is now the default mode. It can be deactivated by an 'axis','tight' clause in a plot command.
- New markers 't' for trefoil and 'f' for filled diamond
- New functions :
- delete() or delete(win) for properly deleting a window.
- title(string) to add a title to the graph.
Version 0.02 (03/23/99) : many bug corrections and ameliorations.
- Matlab look and feel with a ``fancy frame'' around the plot.
- No need to call initCmap() any more at startup. New colors are added automatically with the scilab command ``addcolor()''. Anyway you still have to call graphinit() once at startup (see below)
- New syntax for graphinit :
graphinit()
graphinit('whitebg')
graphinit('blackbg') The choice 'whitebg' or 'blackbg' determines the default background/foreground combination, black/white for 'blackbg' and white/black for 'whitebg'. The switch can be done later with the functions whitebg() and blackbg()
- New functions (with call example)
fig() : creates/activates a window
fig('background',[0 0 1],'foreground',[1 1 0])
fig('colormap','hot')
fig('colormap',[0 0 0;1 1 1])
fig(winNum)
fig(winNum, 'background',[0 0 1],'foreground',[1 1 0])
Properties can be changed after window creation
Version 0.01 (03/19/99) : initial release
Don't expect all this to work if you don't call graphinit() once at the beginning of your session. You have also to call initCmap() each time you create a new window in order to get cthe correct colors when you specify it in plot() call.
Like in matlab the function plot() can accept any number of input arguments. The usual way is to use pairs or triples. Here is an example session :
graphinit()
initCmap()
t=linspace(0,2*%pi);
plot(t,cos(t),t, sin(t))
plot(t,cos(t),'r',t,sin(t)) : red line for the cos
plot(t,cos(t),'ro',t,sin(t),'y^-') : red dots for the cos and yellow
triangles + solid line for the sin
plot(t,[cos(t);sin(t)]) : color cycling is like in matlab
plot(cos(t),sin(t),'axis','equal') : example of property/value setting
plot(cos(t),sin(t),'axis',[0 1 0 1]) : another example the axis vector is
[xmin xmax ymin ymax]
plot(t,cos(t),'3r') : red line, set the linewidth to 3.
Linewidth up to 9 are allowed.
You can also experiment the subplot() function :
subplot(2,1,1); plot(t,cos(t))
subplot(2,1,2); plot(t,sin(t))
You can also use the clf() function to properly clear a graphic
window.
I have made a big effort to produce explicit error messages when the function
detects something wrong in the argument list, so don't be affraid to test
any combination of couple, triples and property/value pairs that seems
correct. Feel free to report me any bugs and/or sugggestion
////////////////////////////////////////////////////////////////////////////////
//
// available markers // available colors (in cycling order)
// //
// 'o' circle // 'y' yellow
// '+' plus // 'm' magenta
// '*' star // 'c' cyan
// 'd' diamond // 'b' blue
// '^' up triangle // 'g' green
// 'v' down triangle // 'r' red
// '.' dot // 'w' white
// // 'k' black
// //
////////////////////////////////////////////////////////////////////////////////
//