Name
colorbar — adds a colorbar to the current shaded plot
Calling Sequence
colorbar(position)
Description
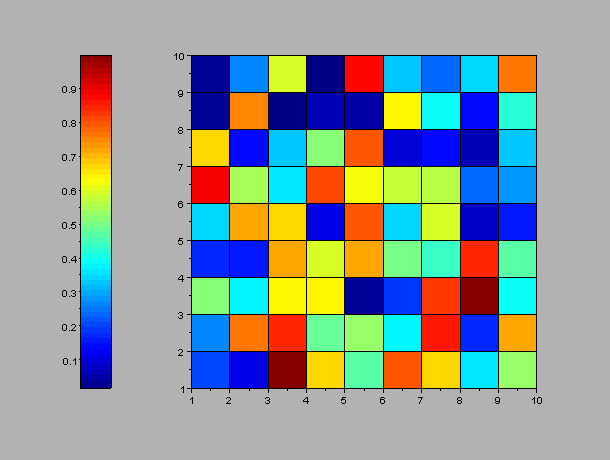
Displays a colorbar in the functions that produce shaded color graphs, e.g. surf, surfl, pcolor, ... This function can also used as a property/value pair 'colorbar',S (see examples below).
The string S can take the values
'on' or 'left' : the colorbar is placed at the left
'right' : at the right
'top' : at the top
'bot' : at the bottom
'off' : removes the colorbar