Name
Axes properties — Emulated Matlab Axes properties
Description
The Emulated Matlab Axes properties are the following :
| nextPlot |
| XDir |
| YDir |
| ZDir |
| XColor |
| YColor |
| ZColor |
| Color |
| XTick |
| YTick |
| ZTick |
| XTickLabel |
| YTickLabel |
| ZTickLabel |
| XLabel |
| YLabel |
| ZLabel |
| Title |
| XGrid |
| YGrid |
| ZGrid |
| XGridColor |
| YGridColor |
| ZGridColor |
| DataAspectRatio |
| DataAspectRatioMode |
| CLim |
| XLim |
| YLim |
| ZLim |
| CLimMode |
| XLimMode |
| YLimMode |
| ZLimMode |
| XScale |
| YScale |
| ZScale |
| ColorOrder |
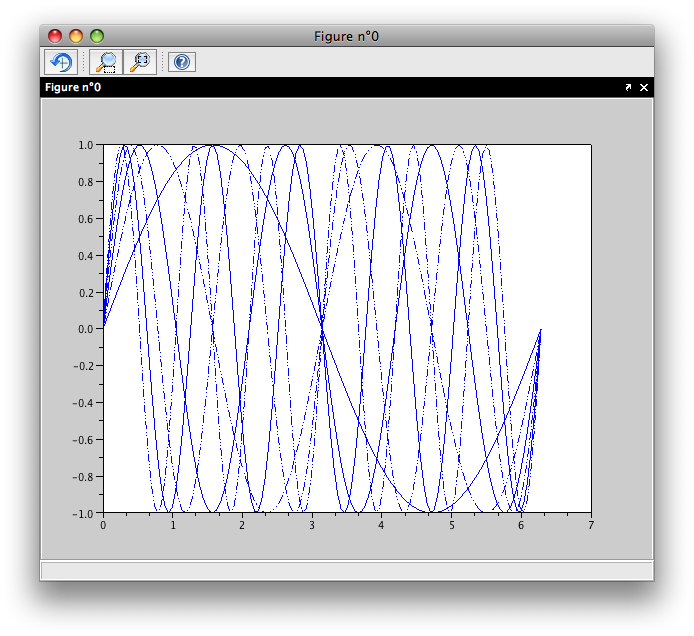
| LineStyleOrder |
| Visible |
| XAxisLocation |
| YAxisLocation |
| ZAxisLocation |
| Box |
| View |
You won't have to use these properties directly as mot of them are used by high level commands like axis. But some of them give some features which are missing or features whose usage is cumbersome.
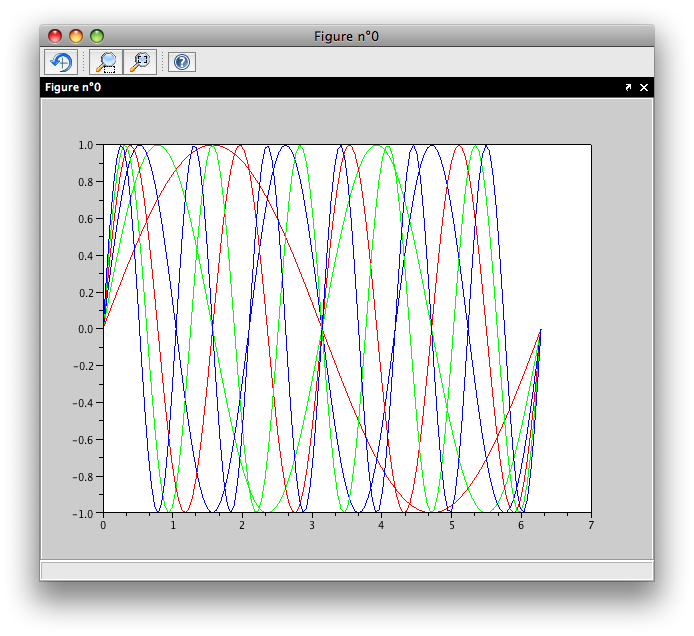
ColorOrder
set(gca(),'ColorOrder',[1 0 0;0 1 0;0 0 1]);
t=linspace(0,2*%pi,128);
plot(t,sin(t'*(1:6)));