| Avertissement |
|
Si vous arrivez directement sur cette page, sachez que ce travail est un rapport d'étudiants et doit être pris comme tel. Il peut donc comporter des imperfections ou des imprécisions que le lecteur doit admettre et donc supporter. Il a été réalisé pendant la période de formation et constitue avant-tout un travail de compilation bibliographique, d'initiation et d'analyse sur des thématiques associées aux concepts, méthodes, outils et expériences sur les démarches qualité dans les organisations. Nous ne faisons aucun usage commercial et la duplication est libre. Si vous avez des raisons de contester ce droit d'usage, merci de nous en faire part . L'objectif de la présentation sur le Web est de permettre l'accès à l'information et d'augmenter ainsi les échanges professionnels. En cas d'usage du document, n'oubliez pas de le citer comme source bibliographique.Bonne lecture... |
| Improve Quality Performance in Manufacturing Plant |
 |
|
Référence bibliographique à rappeler pour tout usage / Please, use this reference when you refer this work Improve Quality Performance in Manufacturing Plant, Li Mei, Stage professionnel de fin d'études, MASTER Management de la Qualité (MQ-M2) Université de Technologie de Compiègne, 2010-2011, URL : https://www.utc.fr/master-qualite, "Travaux, Qualité-Management", réf n° 188 |
|
Kerneos plant at
Fos-sur-Mer is the most important calcium aluminates manufactory in France. Its
location and its capacity allow the great flexibility of product ranges, as well
as to delivery innovation support to Kerneos Research Center. In 2010, some
trials have been carried out in this plant in view of optimal use of resources
and equipments. Achievements were obvious; however plant quality performance was
not as stable as before. Taking the opportunity of my master study in quality
management specialization of UTC, Kerneos industrial department has launched a
project at Fos site, on purpose of improving quality performance. The methodology used to pilot the project is “7 Steps to solve problems”, combined with “PDCA” and “FMEA”. Starting from the analysis of quality result in year 2010, key quality incidents have been identified; then a root causes analysis has been produced aiming to one critical incident; through evaluation of current control measures, the weakness in the trial-production process at mixing station has been highlighted. An improving action plan with solutions was followed by PDCA method. In order to reinforce quality control for trials and changes, the method of process FMEA has been proposed and to be integrated into current quality management system.
Key Words: quality performance, improving, sovle problem, PDCA, FMEA |
|
RÉSUMÉ
L’usine de Kerneos à
Fos-sur-Mer est le site d’aluminates de calcium le plus important en France. Sa
situation géographique et ses capacités industrielles permettent de produire une
gamme variée de produits et représente également le site pilote pour les
innovations mises au point par le Centre de recherche de Kerneos. Des essais ont
été réalisés en 2010 à Fos en vue d’optimiser les ressources et les
installations. Les réalisations sont indéniables, même si les performances
qualité sont moins stables que par le passé. Dans le cadre de mon Master à l’UTC
sur le management de la qualité, la Direction Industrielle Kerneos a lancé sur
Fos un projet d’amélioration de la performance qualité. La méthodologie utilisée pour piloter le projet est : « 7 étapes pour résoudre les problèmes », combinée au « PDCA » et à « l’AMDEC ». A partir de l’analyse des résultats qualité de 2010, les incidents qualité clés ont été identifiés. Puis un arbre des causes a été réalisé sur un incident critique. A travers l’évaluation des contrôles actuels, des points critiques ont été mis en évidence sur le processus d’essais de production à la station de mélange. Un plan d’action d’amélioration, comprenant des solutions, a été réalisé avec la méthode « PDCA ». Dans le but de renforcer la maîtrise qualité lors des fabrications et de la mise en place de nouveaux produits, la méthode « AMDEC » a été proposée pour être intégrée dans l’actuel système de management de la qualité.
Mots Clés : performance qualité, amélioration, résoudre problème, PDCA, AMDEC
|
|
|


As an employee from Kerneos branch in China, I would like to take this opportunity to express my deepest gratitude to my employer. Kerneos is an excellent company which has provided growth for my professional career over last ten years. Without the company’s support and facilitation, I could not realize my Master study in UTC.
The present project has been carried out in Kerneos plant at Fos sur Mer in France. I have received generous support and helps from a number of people who in different ways have contributed to the work. I would like to give my heartfelt thanks to following people:
To sponsor of project, Pierre Baillagou, for his orientation of the project and his great support.
To my supervisors, Didier Veyrat and Vincent Granier, for their constant guidance and kindly support throughout my work; for their valuable experience and detailed suggestions that greatly improved my understanding of in-depth research.
To management team of Fos sur Mer plant, especially to Pascal Lenfant and Christine Delaunay, for their enthusiastic participation and massive helps on daily basis.
To my tutor of UTC, Professor Jean Escande, for his teaching, his follow-up visiting and his valuable guidance; likewise to Professor Gilbert Farge and Professor Jean-Pierre Caliste, for their valuable courses and advice during my study.
Finally, I am in indebted to my family in China, for their endless love and continuous support that allowed me to develop my Master in France so far from them.
AMDEC : Analyse des modes de défaillance, de leurs effets et de leur criticité
COQ : Certificate of Quality
FMEA
:
Potential Failure Modes and Effects Analysis
MQ
: Quality
Management Specialization
PDCA : Plan- Do - Check – Act, is an iterative four-step
management process typically used in business.
PFMEA : Process Failure Modes and Effects Analysis
QQOQCP : Qui Quoi Ou Quand Commend Pourquoi. The method 5 Ws in English – Who's Who, Where, When, How much, How and Why.
RPN : Risk Priority
Numbers
UTC
:
University of Technology of Compiègne
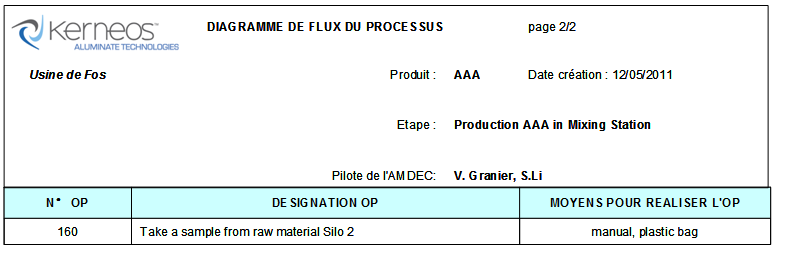
1.4 Manufactoring Process & Control
1.5 Kerneos Plant at Fos sur Mer
3.1 Seven Steps to solve prolems
4.1. Explore and
identify
the problem
4.1.1. Analyze
2010 quality result
4.1.2.
Proritize the key problem
4.2. Investigate and collect
facts
4.3.1.
Construct
root causes diagram
4.4. Prepare solutions and action plan
4.4.1. Check effectiveness of existing control measures
4.4.2. Evaluate risks of root causes
4.4.3. Program new action plan and get validation
4.6. Continous
Improving with PFMEA
Step 2: Establishment of flowchart
Step 3: Identification and assessment of potential
failures
Step 4: Prioritizing and defining the action plan
Step 5: Follow up action plan and verify its
effectiveness
LIST OF FIGURES
Figure 1: Three areas of strategy focus
Figure 2: Map of Kerneos Process
Figure 3: Documentation of quality management system
Figure 4: Improve quality process
Figure 5: Sintering and Fusion manufacturing process
Figure 6: Quality controls during manufacturing - Fusion
Figure 7: Manufacturing Process in Fos Plant
Figure 8: Key factors for an implementation of strategy
Figure 9: Orientation of 2011 quality objectives
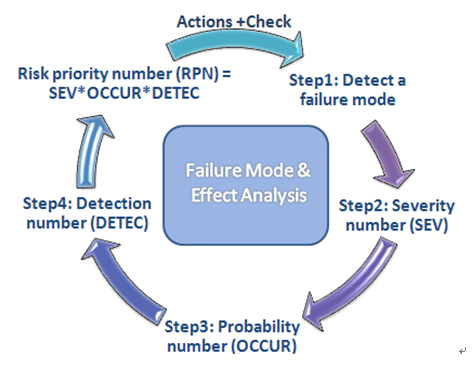
Figure 10: Cycle of 7 steps to solve problems
Figure 13: Analysis of 2010 rejects - standard products
Figure 14: Analysis of 2010 rejects - new product AAA
Figure 15: Root cause analysis basic
Figure 16: Drawing of root cause of pollution incident
Figure 18: PDCA of improving trial production
LIST OF TABLES
Table 2: Prioritization of 2010 quality problems
Table 3: QQOQCP-Quality control of new product in mixing station
Table 4: Previous action plan and effectiveness
Table 5: Risk evaluation of root causes
Table 6: Comparison of solutions
Table 7: Reinforced action plan and follow up
Table 8: Process flow chart form
APPENDICES
Appendix 1: Kerneos process in the plant
Appendix 2: Develop new product process
Appendix 3: Root Causes Analysis Diagram
Appendix 4: Checklist of Transfer RM P
Appendix 5: Logic diagram of Production Process in Mixing Station
Appendix 6: PFMEA Ranking Reference Tables
As the world’s leading manufacturer of calcium aluminates, the ambition of Kerneos is to develop long-term relationships with customers in order to be their preferred supplier. The basic mission is to keep organic growth of performance and reliability, in which the quality is one of key factors to be successful.
Kerneos Fos site is the biggest calcium aluminates plant in France. Its location and its capacity allow the great flexibility of product ranges. Fos site has never stopped trialing and experimenting to deliver innovation to support the ambitions of Kerneos. In 2010, in view of optimal use of resources and equipments, some trials have been performed in the plant : modification of some raw materials, new products, new investment… accompanying with these changes, plant quality performance was not as stable as before, more rejects were produced. How to improve quality performance in the changing environment? It’s one of the key objectives of management team in 2011.
As part of my study in the specialization of quality management in UTC, Kerneos industrial department has decided to launch a project at Fos site, to improve quality performance.
The methodology used to pilot the project is “7 Steps to solve problems”, combined with PDCA and FMEA. These methods are formed in a comprehensive way in the report: The first chapter is the presentation of the Kerneos company and Fos site. The second chapter is definition of project, after that is the third chapter to explain the methodology and planning of project. The fourth chapter is devoted entirely to the key quality problem follow up the key steps: Identification à Investigation à Analysis of root causes à Solutions and action plan à Follow up à Induction of method FMEA in view of continuous improvement. The last chapter presents the result of project, experiences learnt and prospect of future work.
Kerneos is part of the MATERIS Group, one of the worldwide leaders in building construction specialty chemicals, whose majority shareholder is Wendel Investissement. With four divisions:
aluminates, additives, mortars and paints, MATERIS generated a turnover of approximately € 1,700 million in 2009 and employs approximately 8,800 people in 50 countries around the world.
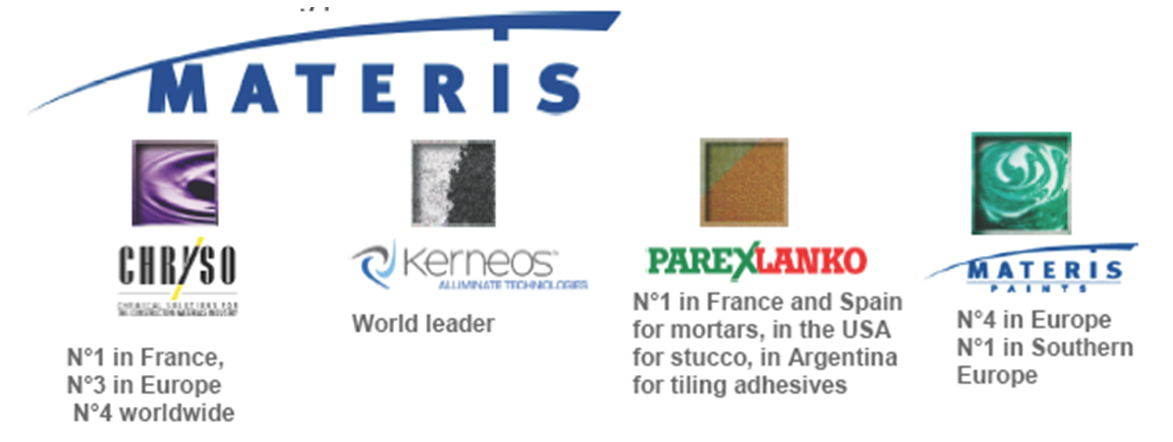
Kerneos is the world leader of calcium aluminates.
Kerneos produces a varied range of high-tech calcium aluminate binders with the brand names CIMENT FONDU®, SECAR®, TERNAL®, PERAMIN®, ALAG®, CALCOAT®, SEWPERCOAT®, LDSF® and OPTIMET™.
These products, with numerous properties, are
designed for refractory,
building chemistry and technical concrete applications, mining, pipes and
wastewater and metallurgical flux.
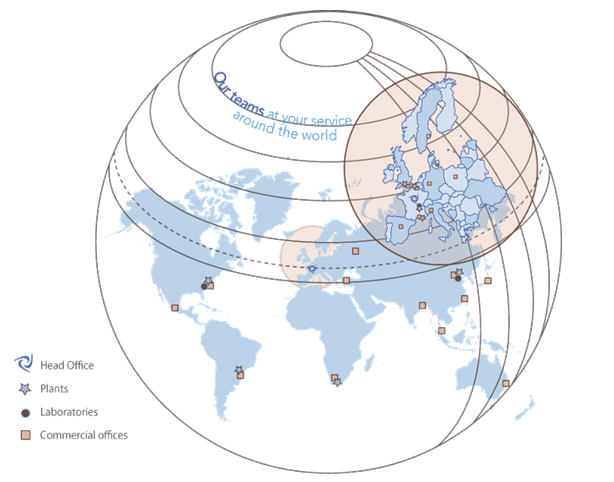
Kerneos has around 20 subsidiaries worldwide and its products are sold in more than 100 countries. In 2009, Kerneos generated a turnover of 290 million euros and currently employs 1,400 people around the world.
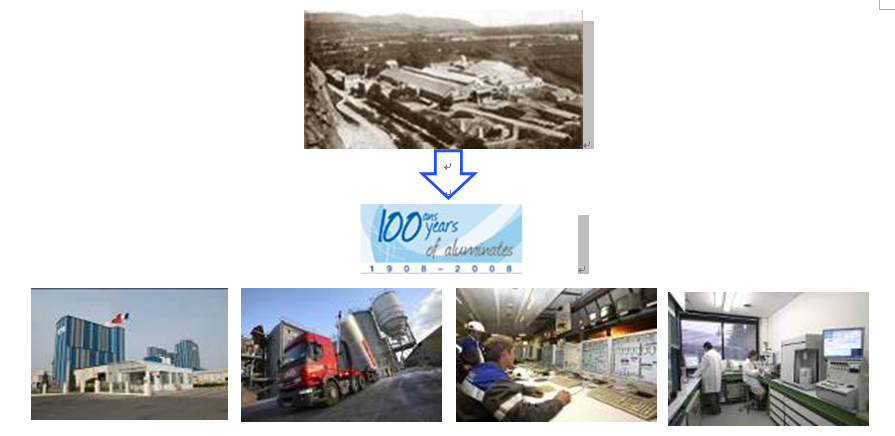
A century
history: THE ALUMINATES PIONEERS
For a century now, Kerneos has been committed to
continuous innovation, with the aim of developing new products, enabling
applications that create added value for client industries to be created and to
grow. Ever since it registered a patent for CIMENT FONDU® in
1908, Kerneos has continued to develop and exploit the numerous
properties of calcium aluminates, in the form of high performance special binders and
mineral reagents.
In the process, Kerneos has discovered and exploited
the following properties of calcium aluminates, refractoriness, rapid
hardening, abrasion and corrosion resistance as well as reactivity with other
mineral and organic materials, in order to create innovative materials.
Driven by its customers’ needs and trends in their industry, today Kerneos is a key player in the refractory concrete, construction chemistry, iron and steel, wastewater and mining markets as well as in numerous construction and civil engineering sectors.
PRODUCT AND
APPLICATION
What are calcium
aluminates?
Calcium aluminates are
obtained by having lime and alumina react at high temperature. Lime (or calcium
oxide) generally comes from limestone, alumina (or aluminum oxide) is contained
in natural minerals such as bauxite, or is refined beforehand in the form of
Bayer alumina. The product of this reaction between lime and alumina, after
cooling, is a hard ore called calcium aluminate clinker.
This clinker when ground
to a powder is called calcium aluminate cement (CAC). Depending on the
proportion of alumina and lime as well as impurities in the minerals used,
these powders may vary in colour from the whitest white via all shades of beige
to jet black.
When mixed with water,
these cements take on a pasty texture to rapidly harden forming a rigid solid,
thus their generic hydraulic binder name meaning a powder that reacts with
water to give a "cement".
Historically, calcium
aluminates were first invented at the start of the 20th century to be used as
hydraulic binders due to their improved corrosion resistance properties
compared to other cements. They were largely developed between the two world
wars because of their quick hardening property, even in cold weather, to
rapidly recommission civil works. Lastly, their resistance to heat saw the
rapid development of castable refractory concrete as a complement to or
replacement of fire bricks.
What are calcium
aluminates for?
[5]
The development of new application processes and the emphases on exceptional technical properties of calcium aluminate as a high performance binder and mineral reagent in a broad array of industries has been the mission of Kerneos for over one century. Kerneos has structured its business around its different markets, with specialized sales, technical and marketing networks spanning the entire globe. Kerneos is present in the following markets:
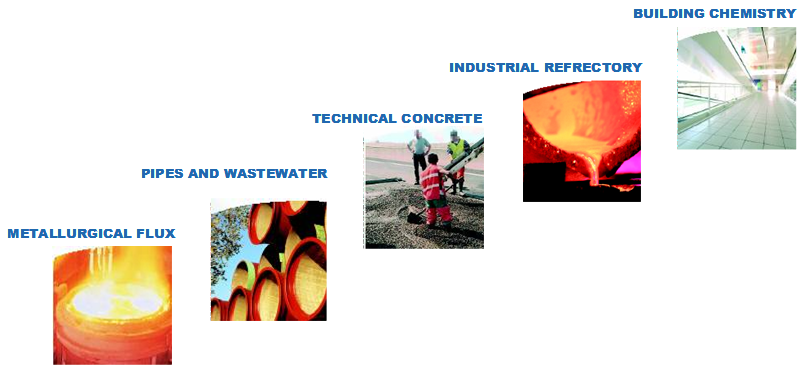
Refractory applications
Resistance to heat and to thermal shocks makes calcium aluminate a fundamental component of refractory applications.
Building chemistry applications
The TERNAL® range for dry mix mortars, is especially suited for floor self levelling, tile laying, concrete repairs, walls and renders and finishing… with PERAMIN® completing this product line, Kerneos has become a reference in the building chemistry applications.
Technical concrete applications
Calcium aluminate concretes have been recognized for centuries for their intrinsically long lives (especially in areas of abrasion, heat and corrosion) and rapid hardening, which allows for a very rapid completion and turnover of work.
Merchants
It offers simple and efficient solutions for all emergency work, as well as at difficult sites where the ordinary performance offered by Portland cements is not sufficient.
Mining
The rapid use and durability of concrete in an extreme environment are
determining factors to a greater extent more than anywhere else.
Pipes and Wastewater
Long known
for their durability in acid and abrasive environments, calcium aluminate
concrete and mortar are also considered to offer high performance for protecting
sanitation networks due to their exceptional resistance to biogenic corrosion.
Metallurgical flux
The calcium aluminate-based synthetic flux have been a reference product for 25
years for many steelmakers producing all kinds of steels using all types of
metallurgical equipment.
1.2 Kerneos Strategy and Missions
STRATEGY:
The ambition of Kerneos, the world’s leading manufacturer of calcium aluminates, is to:
-
Develop long-term relationships with customers in order to be their preferred supplier for calcium aluminates in each geographic area;
-
Spur the integration of a cluster of mineral and organic chemicals specialties for the building industry in order to generate technological synergies with calcium aluminates.
MISSION:
The mission of
Kerneos is to provide innovative technical solutions based on calcium aluminates
to its customers on their various markets:
-
To promote the development of calcium aluminates based solutions;
-
To meet the current and future expectations of the customers and their markets;
-
To keep on ensuring the quality and reliability levels that the customers have come to rely on.
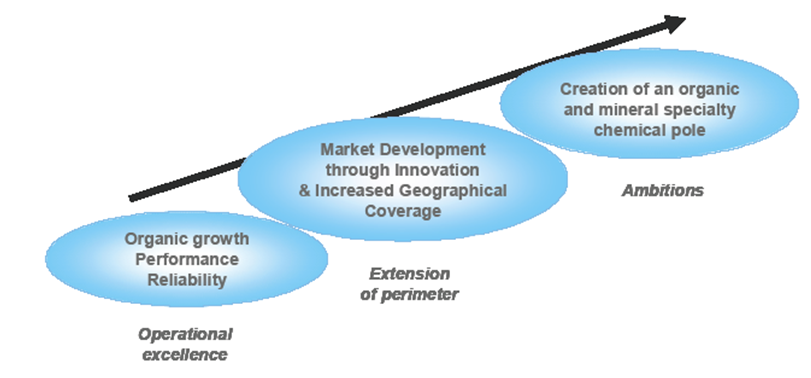
Figure 1: Three areas of strategy focus
The success of this
ambition also relies on the values of Kerneos:
-
To be a responsible industrial company as regards people’s health and safety at work, people’s development and the environment
-
To ensure profitable growth in the activity.
1.3
Quality Management System
Kerneos is thus committed
to a process of quality management in order to:
-
Ensure an efficient running of its operations at world level,
-
Manage the quality of the products and services that are provided in order to remain the preferred supplier of its customers on a long term basis.
The commitments of Kerneos
as regards Quality include:
-
Implementation of a process management with emphasis on client focus and the alignment of the entire organisation according to consistent quality objectives,
-
Compliance with legal and regulatory obligations that are applicable to the marketed products such as CE marking for calcium aluminate cements, REACH registration for substances subjected to this regulation,
-
Guaranteed consistency and compliance of products/services according to our contractual commitments and needs expressed by our customers,
-
Promotion of continuous improvement while periodically assessing our performance and regularly auditing our organisation both internally and externally.
Kerneos’ Quality management system is thus ISO 9001 certified for the entire Design, Development, Marketing and Sales of calcium aluminates at world level.
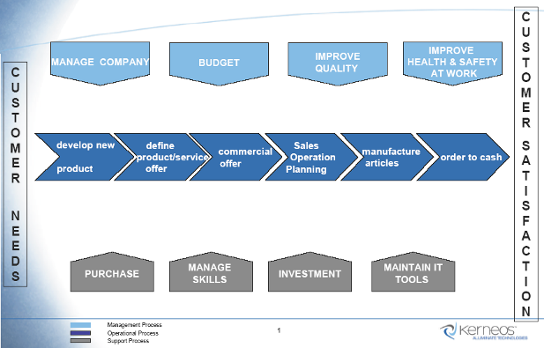
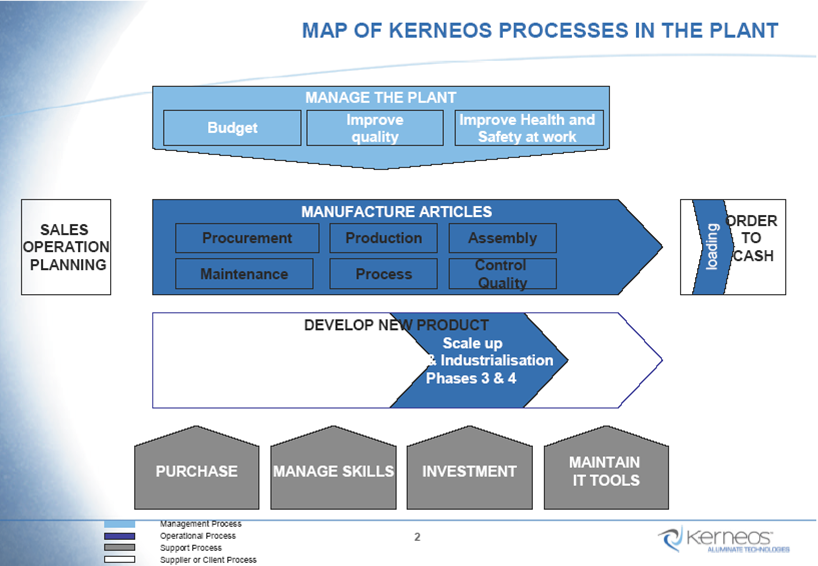
Figure 2: Map of Kerneos Process
The head of Quality Management System and Certifications is the company’s representative under the ISO 9001 norm. The head ensures that all processes required for the quality management system are set, implemented and maintained, and reports back to the Management on the running of the quality management system and any need for improvement.
The Quality Committee is responsible for:
-
Ensuring the proper running of the system (adequacy and application of planned provisions)
-
Ensuring the consistency of the systems of the various units and coordinating inter-sites actions
-
Reporting on the running of the system and suggesting improvements
-
Ensuring that the documents are up to date.
The Quality Coordinators are under the authority of the Unit Director. As regards function, they report to the Head of Quality Management System and Certifications for all missions related to the application of the company’s Quality System.
Each Unit Director defines the level of authority and responsibility entrusted to its Quality Coordinator.
Documentation
The document control of the Quality Management System at Work is computerised. The managers of this IT application are the quality Coordinators.
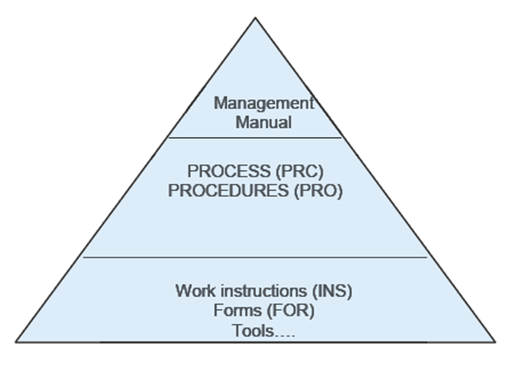
Figure 3: Documentation of quality management system
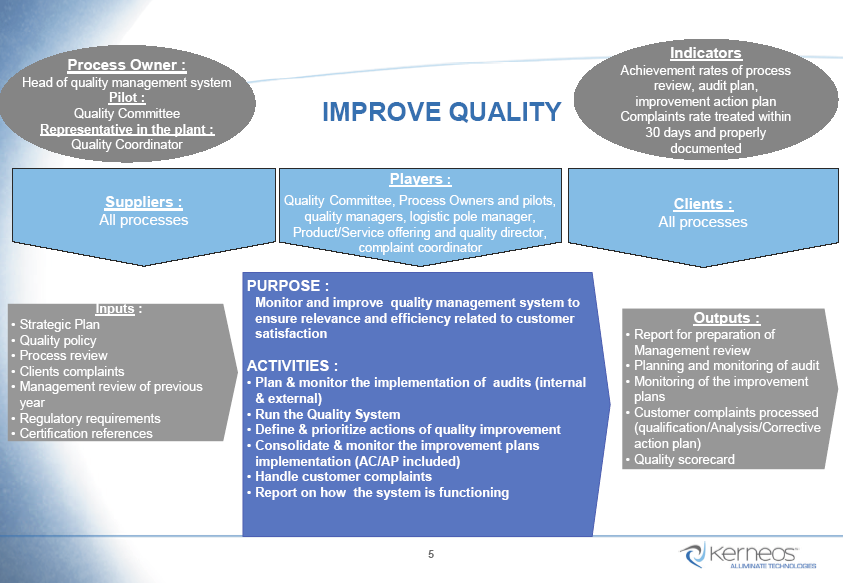
IMPROVE QUALITY PROCESS
This
process aims to ensure the proper running of the processes, to make suggestions
to improve the quality and to ensure improvement plans are implemented. This
process is driven by the Head of the Quality Management System and
Certifications and by the Quality committee.
Improvement
actions are defined on the basis of:
- Regular reviews of the indicators
- Customers complaints
- Dysfunctions and internal nonconformities
- Audits and other observations
- Process reviews carried out by the pilots
They
are recorded and followed:
- At each unit level in the way of projects, corrective
or preventive actions.
- Centrally in the way of a consolidated improvement plan for monitoring progress by the quality committee on actions resulting from an internal or external audit, or from a complaint by a
customer.
1.4. Manufacturing
Process & Control
Kerneos manufactures
calcium aluminates which are mainly composed of alumina and lime using two
kinds of manufacturing processes:
-
Fusion (Fusion)
-
Sintering ( Fritage)
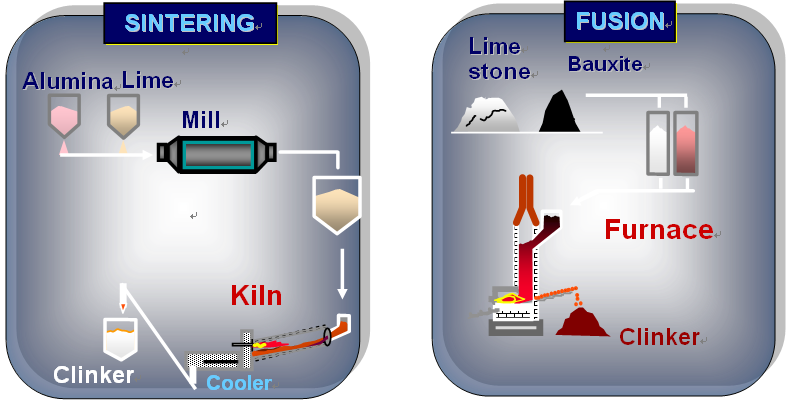
Figure 5: Sintering and Fusion manufacturing process
Quality controls during
manufacturing
In order to guarantee compliance
with the internal specifications of the shipped products, qualitative and
quantitative controls are performed throughout the production chain.
In the fusion plants:
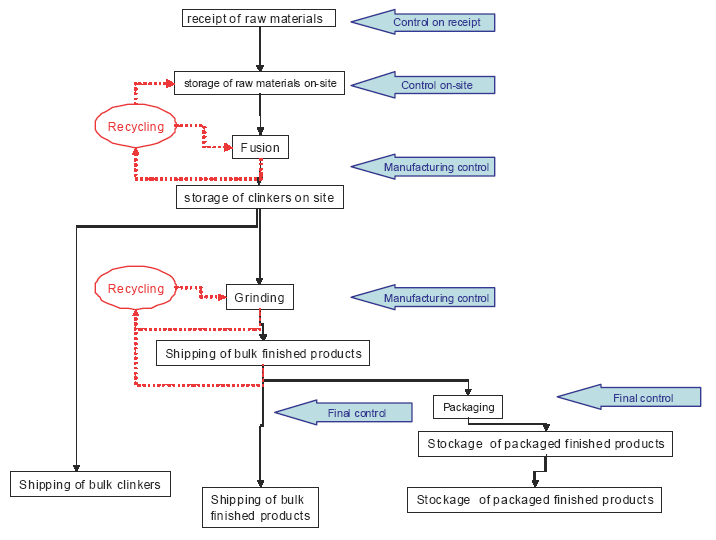
Figure 6: Quality controls during manufacturing – Fusion
The project is implemented in the Kerneos Fos site that is located in Fos-sur-Mer of France. Fos site is remarkable in Kerneos both for his history and its capacity:
-
The biggest calcium aluminates plant in France
-
Built in 1922 between scrubland salt march and the Mediterranean Sea
-
A multi products and multi packing plant à Products sold in worldwide
-
Great flexibility to expand product ranges à Delivery innovation support to Kerneos Research Center
-
Certified ISO 9001 since March 1995
-
Automatic sampling system and modern laboratory
-
Quality reliability ≥ 99%
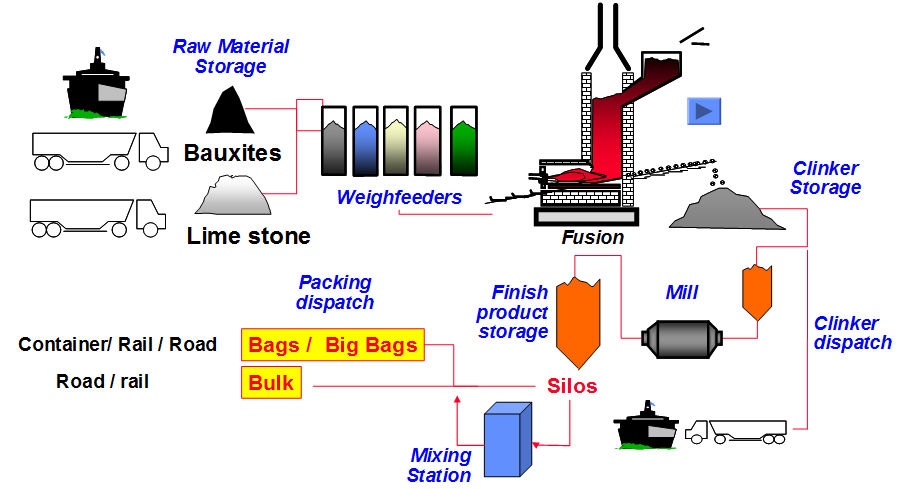
Figure 7: Manufacturing Process in Fos Plant
Operational Excellence is a pillar of Kerneos strategy, Quality towards the permanent search for Excellence, through the optimal use of resources & equipments at the benefit of customers, shareholders, employees.
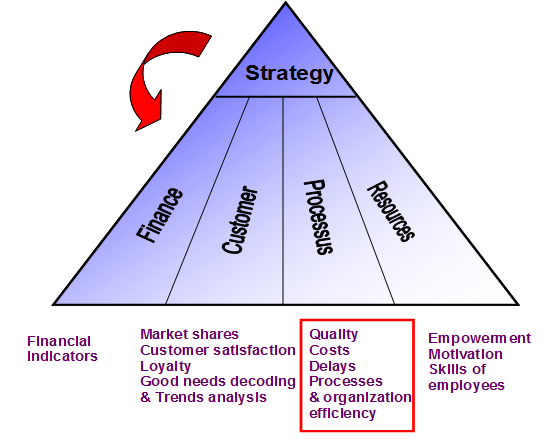
Figure 8: Key factors for implementation of strategy
In order to achieve optimal
use of resources and equipments, during last several years, Kerneos industrial
department has lunched a serie of actions in their manufacturing plants worldwide
: increase of production capacity, use of alternative raw materials and fuels,
industrializations of new products…… These new actions have brought obvious
achievements, at same time, changes also brought variation of quality
performance. In the short term, Kerneos has decided to give priority to
reinforce the quality management of change.
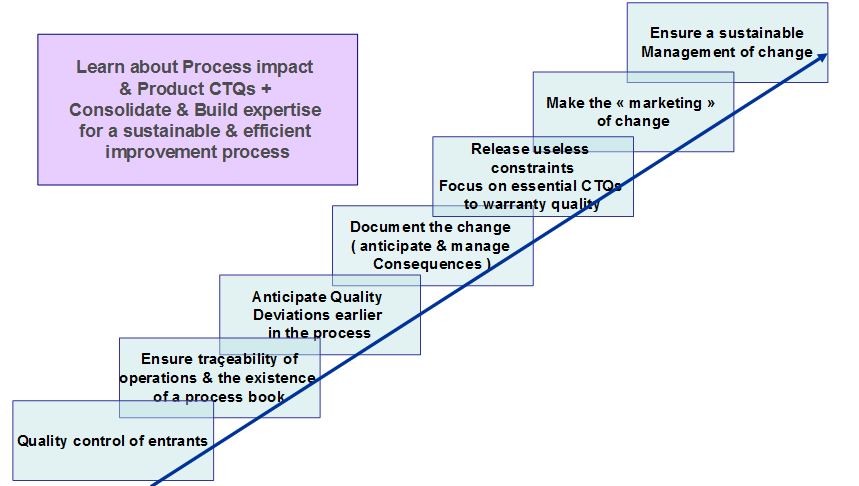
Figure 9: Orientation of 2011 quality objectives
Fos site is the biggest manufactory plant in Kerneos, as well as the biggest calcium aluminates plant in France. Its location and its capacity allow the great flexibility of product ranges, Fos site has never stopped trialing and experimenting to deliver innovation to support the ambitions of Kerneos. In 2010, in view of optimal use of resource and equipments, some trials had been implemented in the plant : new raw materials, new fuels, new products, new investment… accompanying with these changes, plant quality performance was not as stable as before, more rejects were produced. In 2011, the plant is facing new changes as well, how to avoid similar problems as in 2010? How to improve quality performance in changing environment? It’s one of key objectives of plant management team in 2011.
For
above reasons,
taking the opportunity of my study
in the specialization of quality management
in UTC, Kerneos industrial department has decided to lunch a project for Fos
site :
Objective: Improving the quality
performance in Fos site.
Tasks:
-
analyze quality result of year 2010, identify key quality incidents
-
analyze the root cause of the key incident
-
take corrective actions and reinforce supervision
-
recommendations to improve the quality management system in Fos site
In order to reach the objective, I have
translated above tasks into following questions:
-
What are the key quality problems in year 2010?
-
What are the root-causes of key problems? Are those causes under control today?
-
How to avoid the occurrence of similar quality incidents? Which method or tool of quality management is suitable to control the risks?
-
How to improve the quality management system in the manufactory?
Project Team:
Senior Quality Manager - Didier
VEYRAT
Industriel Performance Director - Vincent GRANIER
Project team in Fos Site:
Performance Manger - Pascal
LENFANT (Project Coordinator)
Quality Manager - Christine
DELAUNAY
Process Engineer - Lisa
MALCOTTI
Dispatch
Engineer - Dominique TORGUE
Project Implementation - Mei LI
Period: 6 months
This project is started
from middle of February 2011, and continued for six months.
The methodology used to
pilot the project is “7 Steps to solve problems”, combined with PDCA and FMEA.
These methods are formed in a comprehensive way in the report.
3.1 Seven steps to solve problems
I choose the method of “7 steps to solve problems” to pilot the project : Identification of a key problem à Investigation à Analyst of root causes à Solutions à Action plan à Follow up à Continuous improvement.
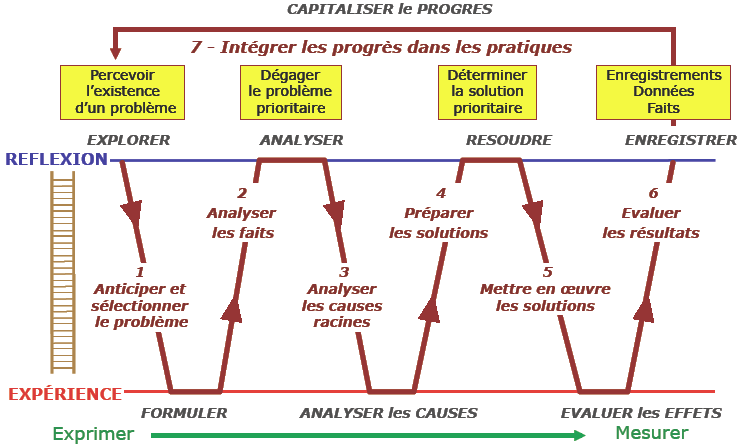
Figure 10: Cycle of 7 steps to solve problem [6]
From step 1 to step 4, I have chosen different tools to adapt the need of quality control or quality management, detailed explanation are in the 4th chapter of report : “ Realization of Project”.
From step 5 to step 7, I have inducted the method
of PDCA to ensure the successful implementation of action plan and continuous
improvement.
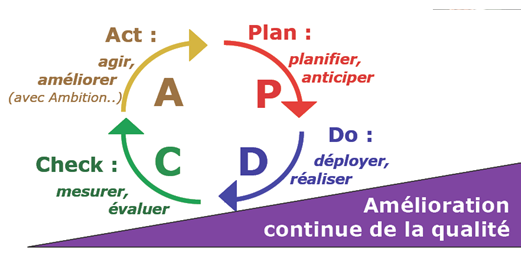
PDCA (plan–do–check–act) is an iterative four-step management process typically used in business. PDCA is a successive cycle which starts off small to test potential effects on processes, but then gradually leads to larger and more targeted change.
PLAN
Establish the objectives and processes necessary to deliver
results in accordance with the expected output (the target or goals). By making
the expected output the focus, it differs from other techniques in that the
completeness and accuracy of the
specification is also part of the improvement.
DO
Implement the new processes, often on a small scale if
possible, to test possible effects. It is important to collect data for
charting and analysis for the following "CHECK" step.
CHECK
Measure the new processes and compare the results
(collected in "DO" above) against the expected results (targets or
goals from the "PLAN") to ascertain any differences. Charting data
can make this much easier to see trends in order to convert the collected data
into information. Information is what you need for the next step
"ACT".
ACT
Analyze the differences to determine their cause. Each
will be part of either one or more of the P-D-C-A steps. Determine where to
apply changes that will include improvement. When a pass through these four
steps does not result in the need to improve, refine the scope to which PDCA is
applied until there is a plan that involves improvement.
Fos site has never stopped
trialing and experimenting to deliver innovation to support the ambitions of
Kerneos. By end of the project, the method of PFMEA has been inducted, in order
to reinforce the quality control in the manufacturing process: starting from
new product trial manufactory, this method will be integrated into current
quality management system.
Failure
modes and effects analysis (FMEA) is
a
procedure in
product
development and
operations
management for analysis of potential
failure modes within a system for classification by the severity and likelihood
of the failures. A successful FMEA activity helps a team to identify potential
failure modes based on past experience with similar products or processes,
enabling the team to design those failures out of the system with the minimum
of effort and resource expenditure, thereby reducing development time and
costs. It is widely used in manufacturing industries in various phases of the
product life cycle and is now increasingly finding use in the service industry.
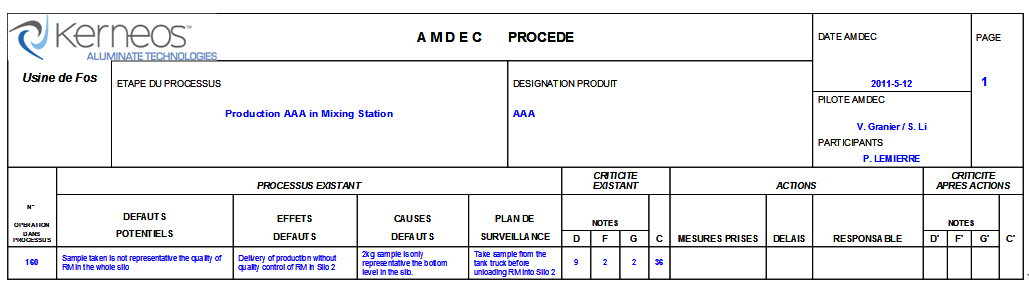
PFMEA:
Process Failure Modes and Effects
Analysis. It’s a systematized
activity intended to Recognize
and evaluate the potential for
failure of a process and its effects.
In order to make sure the progress of project, after discussed with project team, I have prepared a planning at beginning of project, with follow up remarks.
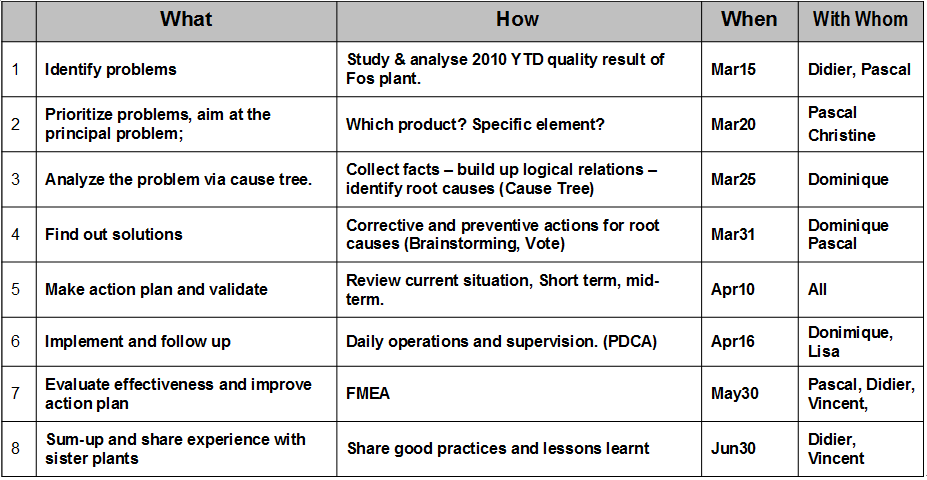
Basing on the general planning, I have also prepared short term action plans to follow up the progress weekly or monthly. (Please see Appendix.)
4.1. Explore and
identify problem
4.1.1. Analyze 2010 quality result :
Standard Products:
2010 Quality performance data:
(The data sheet is
confidential)
From analyse of 2010 rejects, 3
parameters have been identified out of specification with high frequency, from
the percentage, parameter R is the key one.
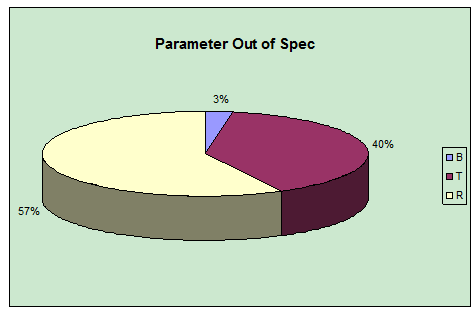
Figure 13: Analysis of 2010 rejects - standard products
Analysis the evolution of parameter
R:
(Figures and datas are
confidential.)
From the evolution analysis of
parmeter R and its elements, the cause of deviation has been focused on the
quality of new fuel.
Problem identified
-
Lack of quality control of new fuel.
Current Control mesure:
Have stop using the new fuel in 2010.
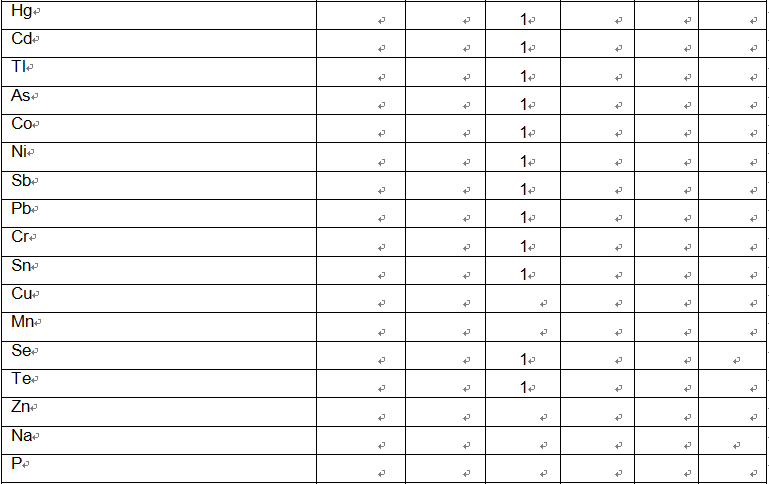
Analysis of COQ of fuel supprliers:
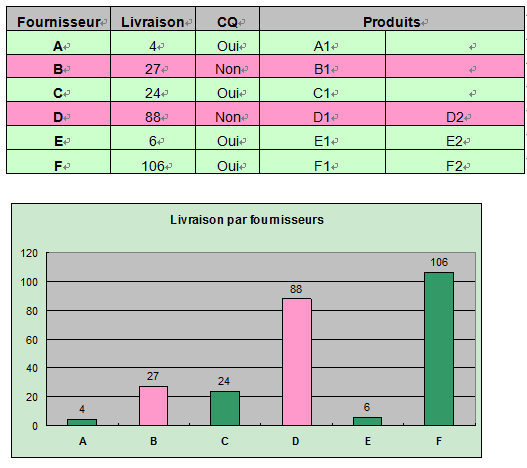
In view of exploring the problem of fuel, an audit has been made on the Certificate of Quality delivered by suppliers. The characteristices provided at each delivery have been compared to the requested parameters and a summary has been sent to purchasing department to ask the suppliers to provide with each delivery a COQ including the requested parameters.
Please refer to APPENDIX 7. Fuel COQ Analysis
New Product AAA
Analyse data of Rejects :
(Quality result data sheet is
confidential)
From analyse of data of reject ,
2 important parameters (P & C) have been identified as the key elements
with reusult of out of specification.
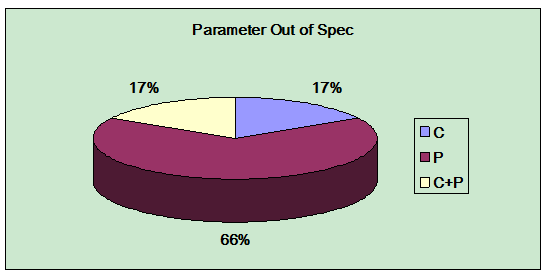
Figure 14: Analysis of 2010 rejects - new product AAA
Analysis of parameter P and
parameter C:
(Figures and datas are
confidential.
From evolution analysis of
parmeter P and C, causes of deviation have been focused on two problems :
-
Mechanical problem of mixer.
-
Pollution of raw material
4.1.2.
Prioritize the Key problem
In 2010, some improvement actions have been performed for above problems. after review of current control situation and evaluation of the criticity, the problem of “Pollution of raw material in mixing station” has been identified as the key problem.
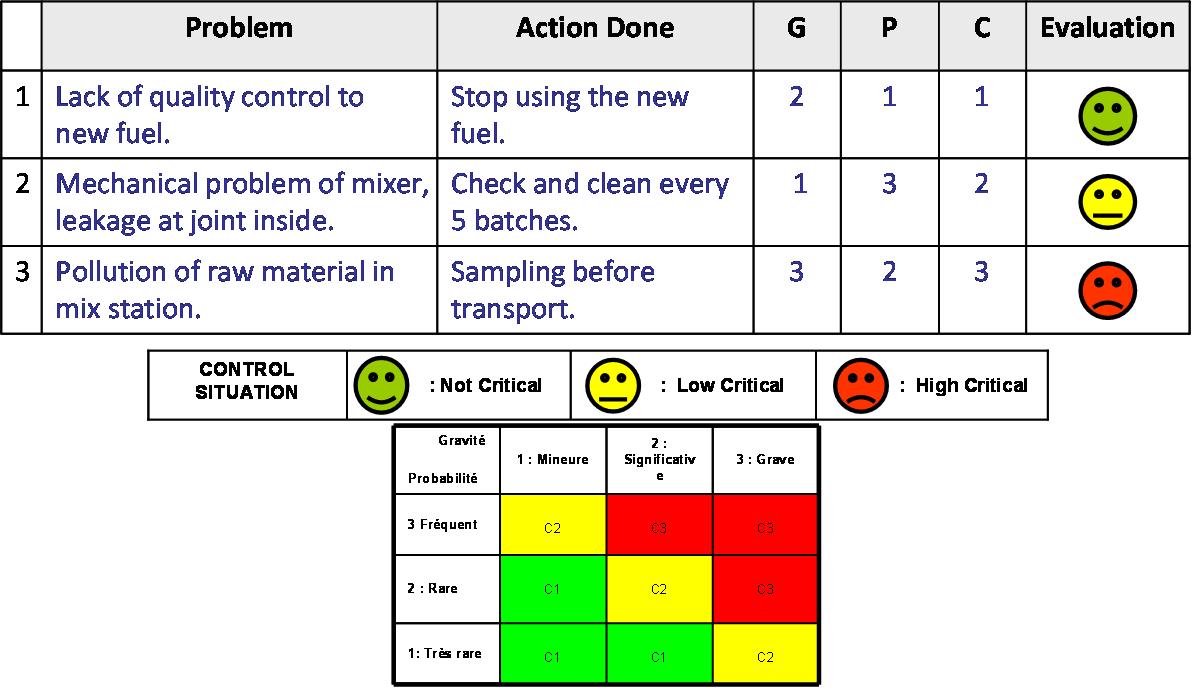
Table 2: Prioritization of 2010 quality problems
In order to clarify and define the problem, a QQOQCP
has been produced after a specific meeting with project team.
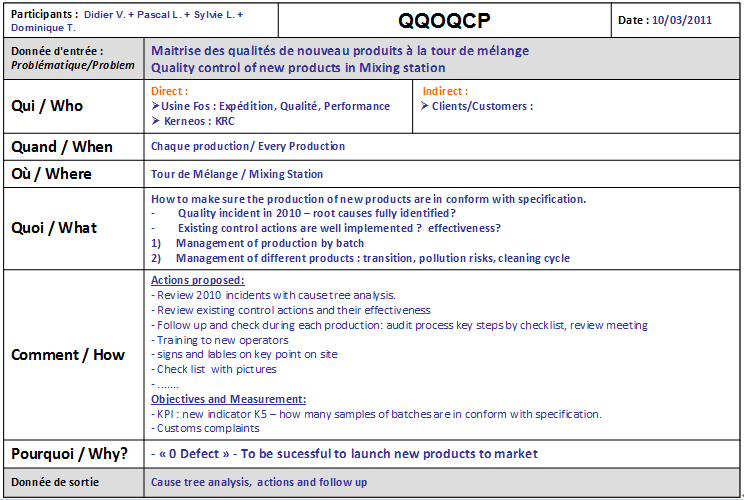
Table 3: QQOQCP-Quality control of new product in mixing station
4.2.
Investigate and collect facts
Product AAA is a new product launched on the market in year 2010, its excellence performance is welcomed by customers. In 2011, sale forecast of AAA is multiplied by 3 times, production volume in mixing station will be increased from about 40 operations per month to 150 operations per month.
4.2.1. Observation of production
In order to understand the whole process of producing AAA, the first thing I did is observation in the workshops, from the preparation of the raw materials to the delivery of finish product, I have taken photos, and taken notes for key points.
Production of AAA is in the mixing station, raw
material is stored in semi-product silos, need to transport by tank truck
before each production.
During studying of production documents and data,
it’s also important to confirm and double check all information on site. I have
followed up production during three months.
4.2.2. Collect and study data and documents
There
are two main departments concerning the production of AAA, Dispatch and Quality
control. I have collected following documents from these two departments for
study:
-
Operation manual of Mixing
station
-
Production procedure
-
Production record
-
Quality control record
-
Checklist of transport raw
material
-
Drawings: Mixing station,
Mixer…
-
Quality incidents analysis
reports
Besides meeting with project team members, I have interviewed
with following employees who are doing production and operation on site:
a) P. LEMIERRE: Technician of Dispatch Dept. à in charge of operation in mixing station;
b) P. OGGERO: Technician of Quality Dept. à in charge of quality control of new product in
mixing station.
c) Other operators
During production, I have followed technician and
operators in order to learn the real situation, clarify the facts and the
information I have collected.
4.3.1. Construct the root
cause diagram
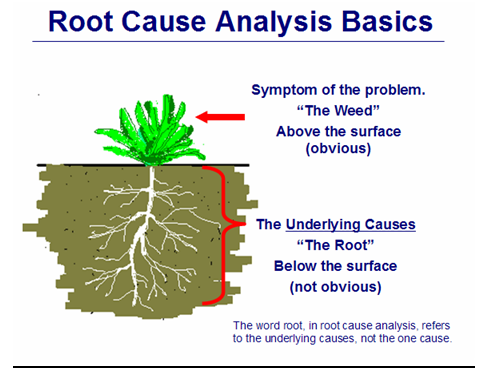
Figure 15: Root cause analysis basic [9]
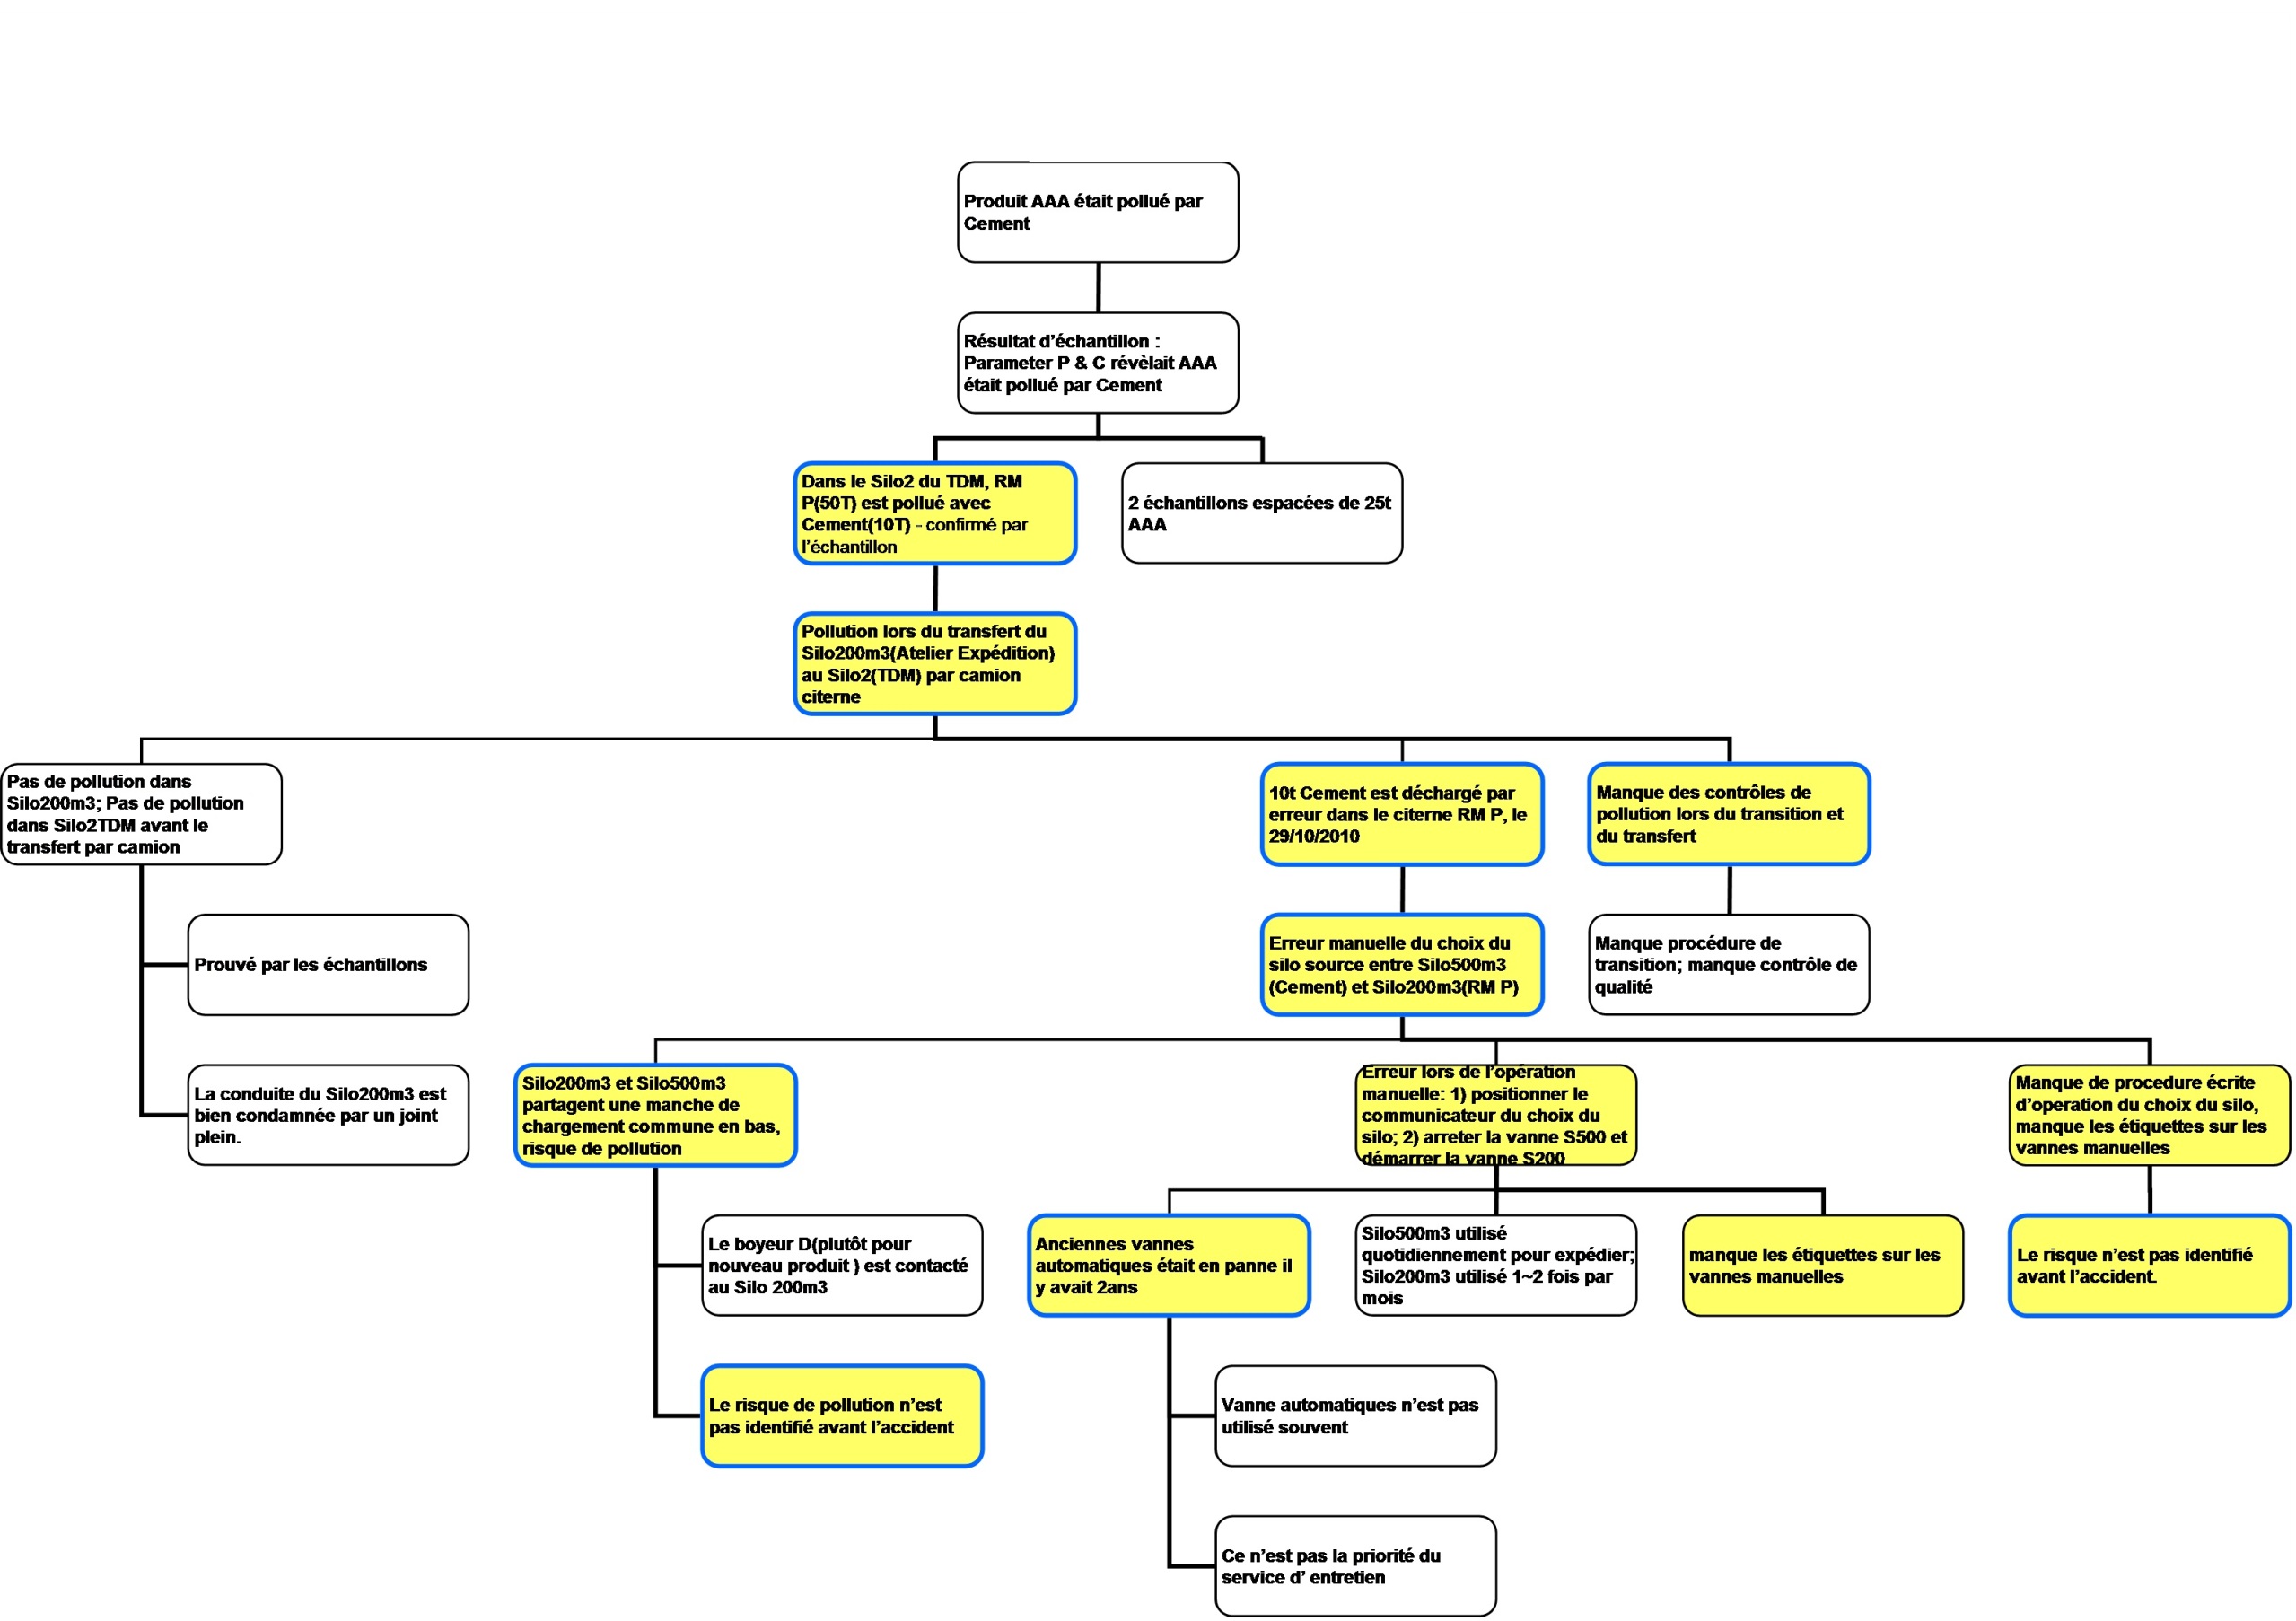
Basing on the facts I have investigated and collected, a detailed cause tree diagram has been constructed through the logic way. The cause trees had been reviewed and updated several times till getting the final version with agreement of all concerned.
Please refer to Appendix 3: Root cause analysis diagram
The cause of pollution has been identified through analysis: during transporting raw material from expedition workshop to mixing station by tank truck, 10 tons cement was discharged into the tank truck by a mistake of manual switch valves between silos.
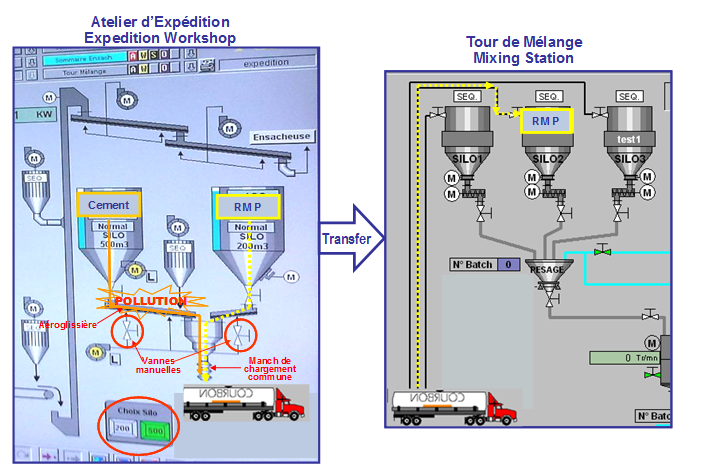
Figure 16: Drawing of root cause of pollution incident [3][4]
Further
analysis of the cause of human mistake, 4 root causes have been identified as
below:
a)
Risk of pollution hadn’t been identified before launch
the production of new product AAA.
b)
Lack of quality control during transporting raw
material P by tank truck;
c)
Automatic switch valve has been broken for 2 years;
d)
No working instruction for manual operation of switching
silos.
4.4.
Prepare solutions and action plan
4.4.1. Check effectiveness of existing control
measures
Year
2010, some control actions have been launched after the pollution incident, I
have checked and reviewed the effectiveness during production in March.
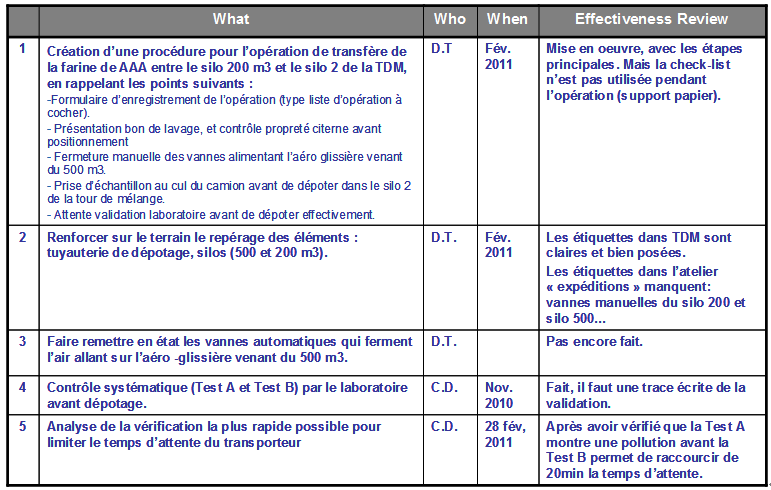
Table 4: Previous action plan and effectiveness
4.4.2. Evaluate risks of root causes
Basing on the effectiveness of current control measures, a risk evaluation has been done to each root cause. The results show that we need to improve the following items:
-
Lack of maintenance to automatic valve in expedition workshop.
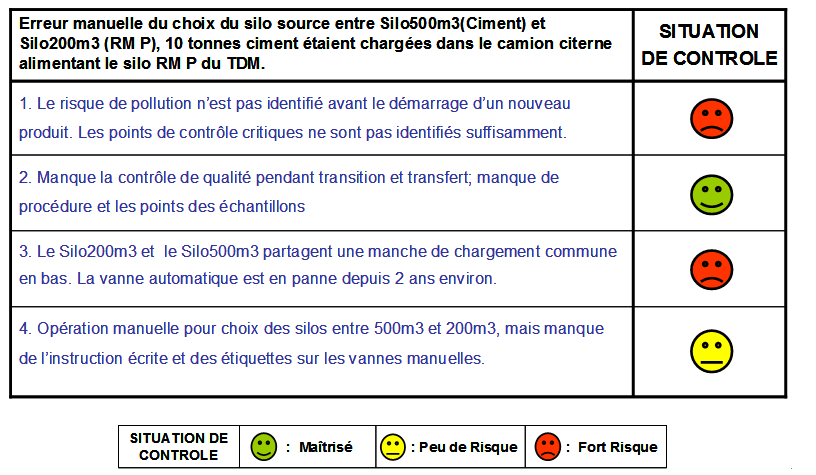
Table 5: Risk evaluation of root causes
4.4.3. Program new action plan et get valitation
A
new action plan is prepared with project team in order to eliminate risks of
reoccuration of the incident of pollution.
(Please see action plan in 4.5.)
It has been validated
after fully discussion.
From
the root causes analysis, we have identified the weakness in the existing
quality management system
à Risks of production process haven’t been fully
identified before trial production of new product in the mixing station.
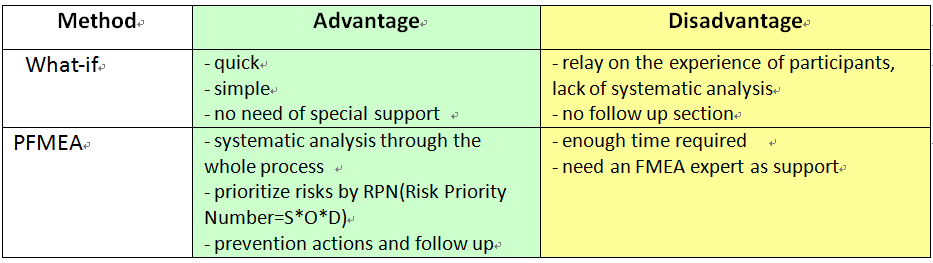
Focus on this problem, two risks analysis methods had been proposed: “What-if” (Check-list) and “PFMEA” (Process Failure Modes and Effects Analysis). After discussion and comparison between two methods, PFMEA is chosen as the solution.
From
March to May 2011, there has been one production per week. I have presented to
workshops during production in order to follow up the action plan:
-
Check the progress of each action
-
Make sure the implementation of new checklist and procedures;
Detailed checklist example please refer to Appendix 4: Checklist of Transfer RM P
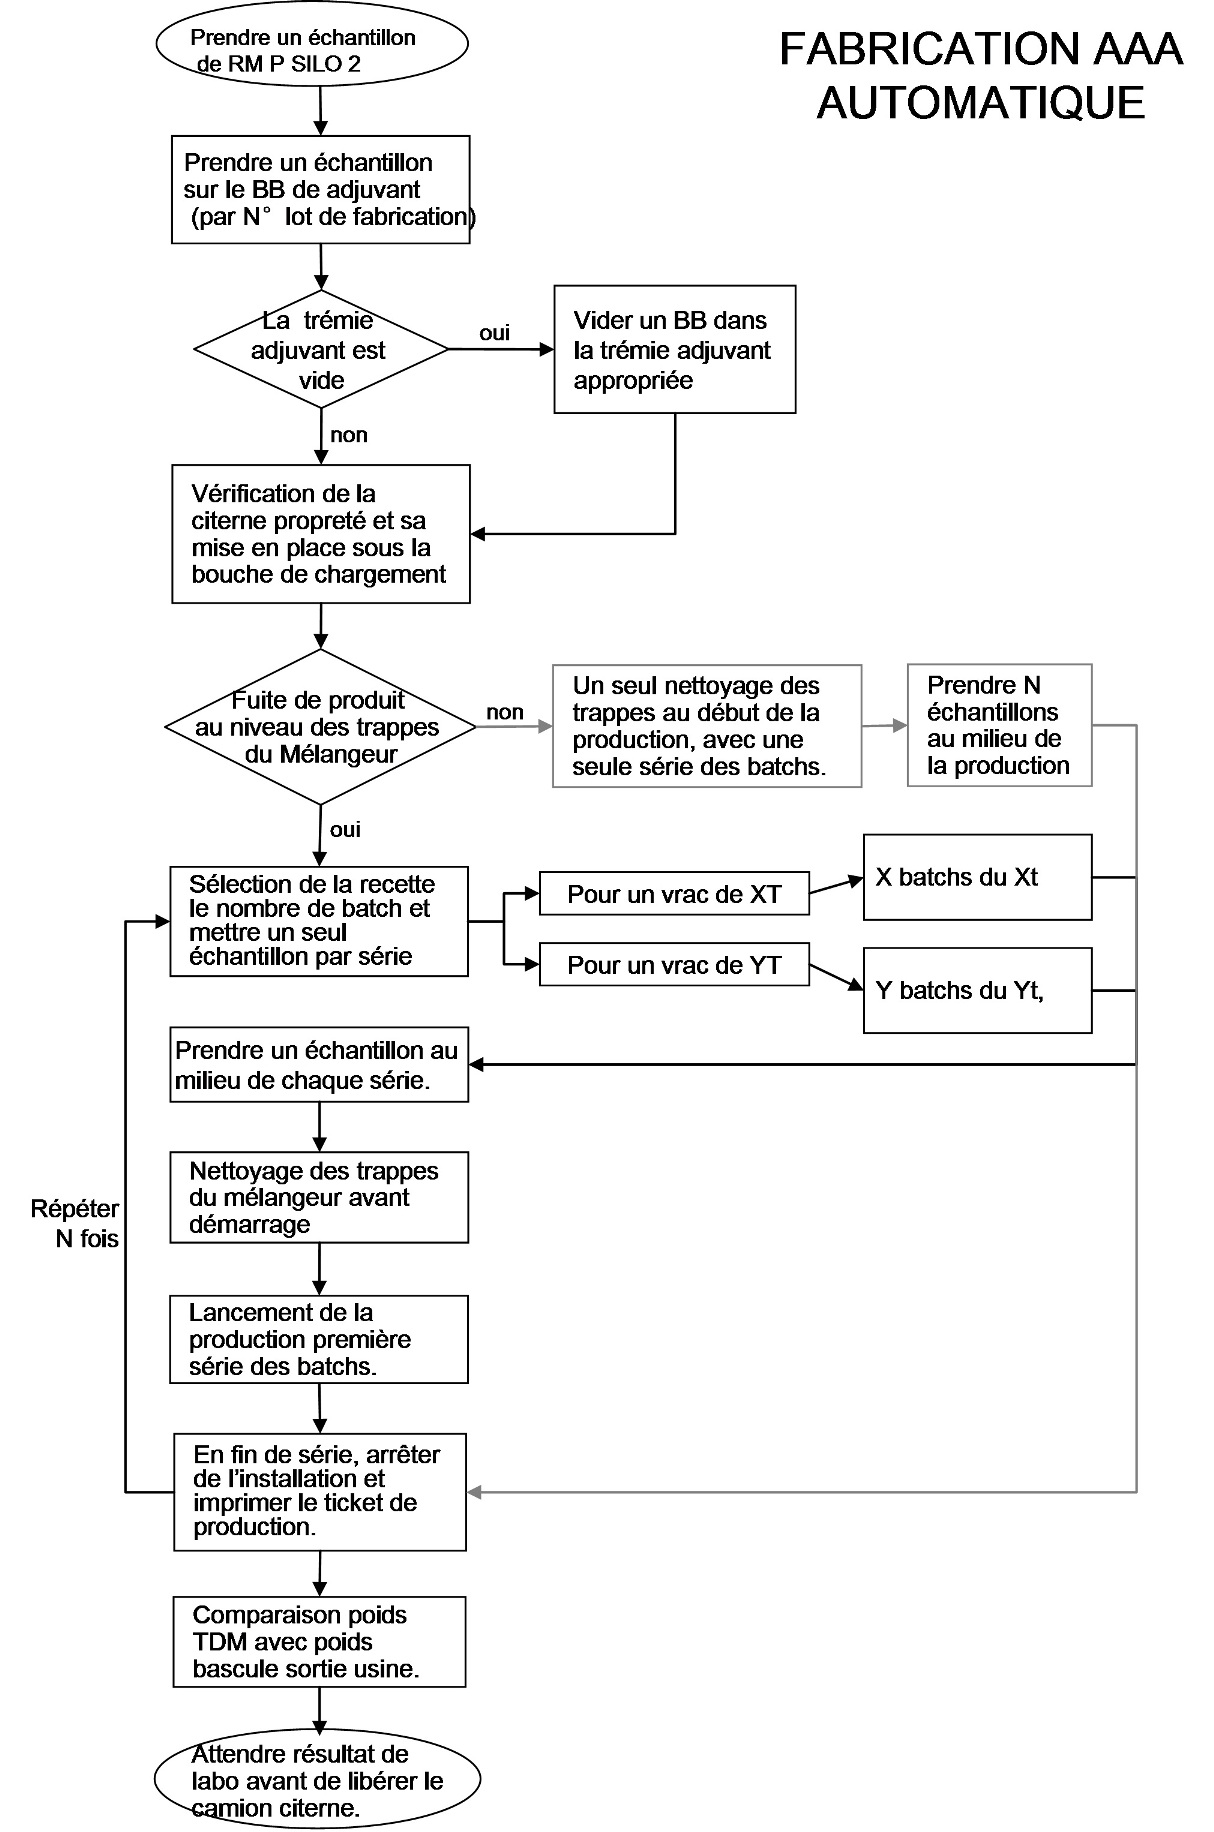
Detailed logic diagram example please refer to Appendix 5: Logic diagram of Production Process in Mixing Station
-
Communication with responsible department mangers
- Regular
Meeting by project team in order to review and update action plan
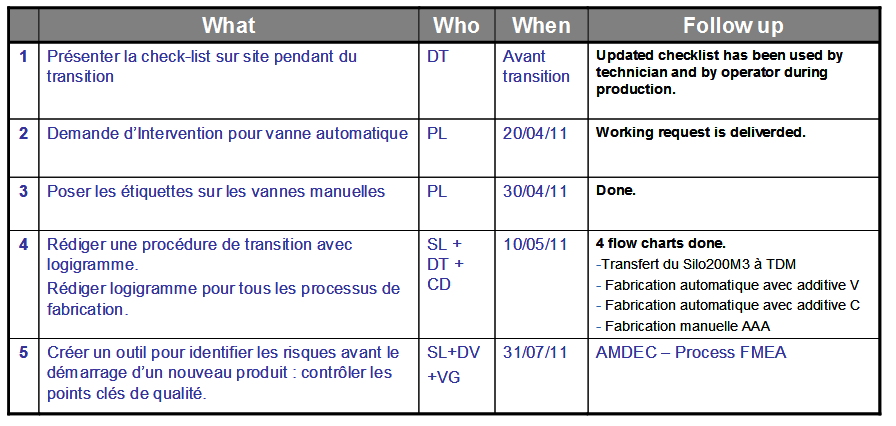
Table 7: Reinforce action plan and follow up
4.6. Continuous improvement - PFMA
From
root cause analysis of the key quality incident in 2010, we have identified a
weakness of existing quality management system: risks identification and
prevention are not sufficient before launching new product in the mixing
station. We have decided to implement PFMEA method to improve the risk analysis
and quality control of quality management system.
From
May of 2011, we have started to practice PFMEA to the production in mixing
station, following below 5 steps to pilot the implementation of PFMEA:
a)
Assembly of the team
Support Expert:
V. GRANIER
Pilot :
M.LI & P. LENFANT
Team members: C. DELAUNAY, D. TORGUE, P. LEMIERRE
b)
Define the scope of
process
Product AAA: transport raw material à Production à Dispatch
Installations: Expedition workshop à Mixing Station à Weight Bridge
c)
Planning
Complete the 1st version of PFMEA by July
31st 2011.
Step 2: Establishment of flowchart
Basing
on the logic grammas we have completed for the transport and production, breaking
down process into steps, flowchart has been completed.
Step 3: Identification and assessment of
potential failures
Several meetings have been organized with the technician
of mixing station who is the direct leader on site during each operation. Step
by step following the flow chart, we are now working on identification and assessment each operation: function(s), potential failure mode(s), failure mode
effect(s), failure mode cause(s), and controls for detecting or preventing the
failure mode(s);
Step 4: Prioritizing and defining the action
plan
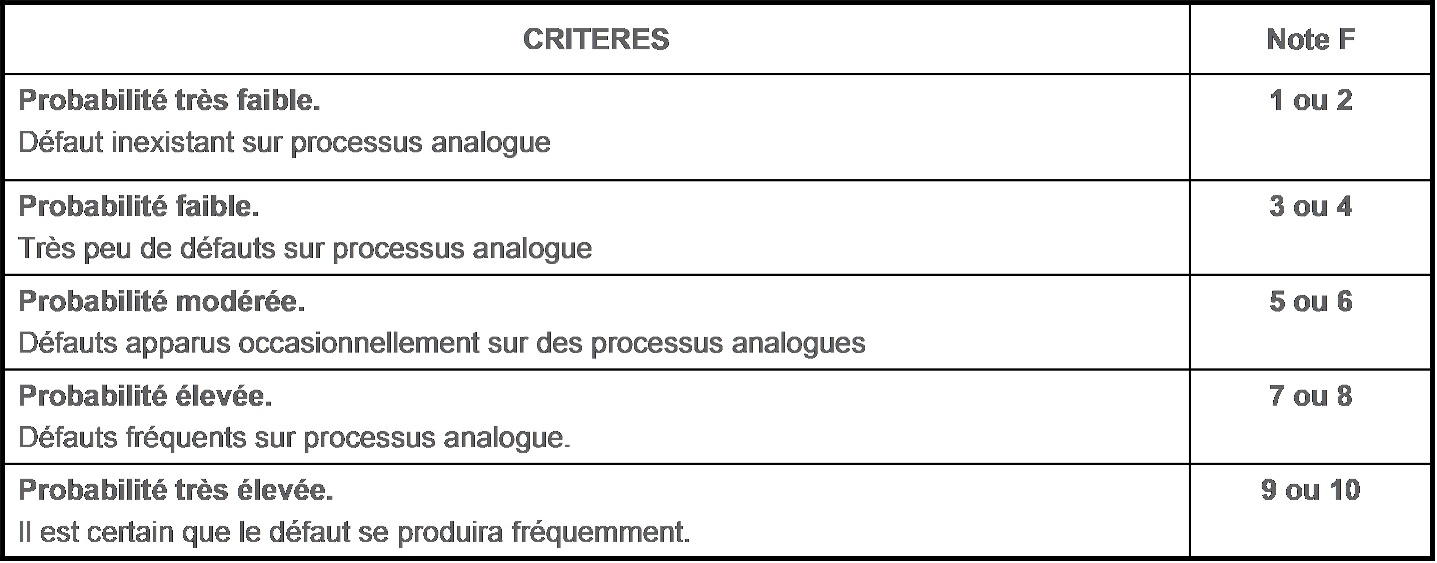
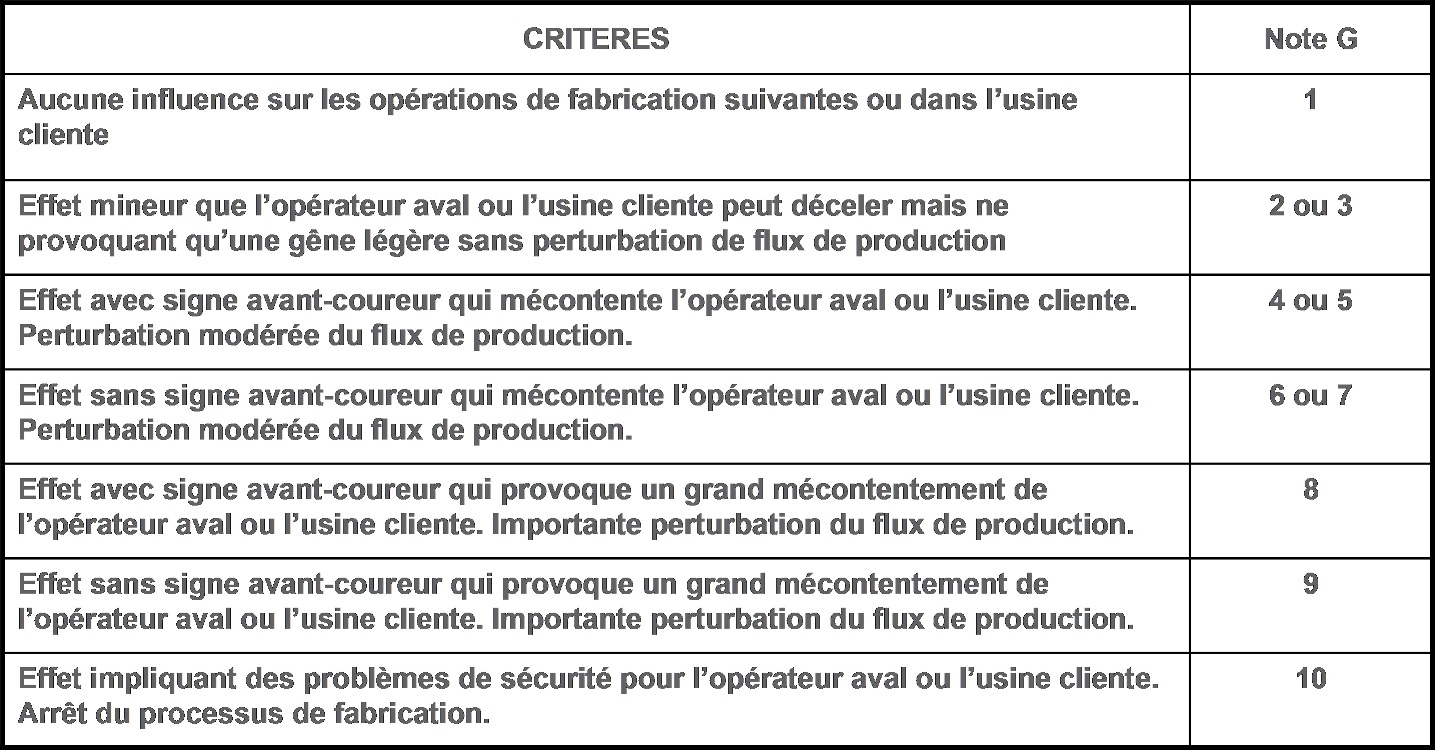
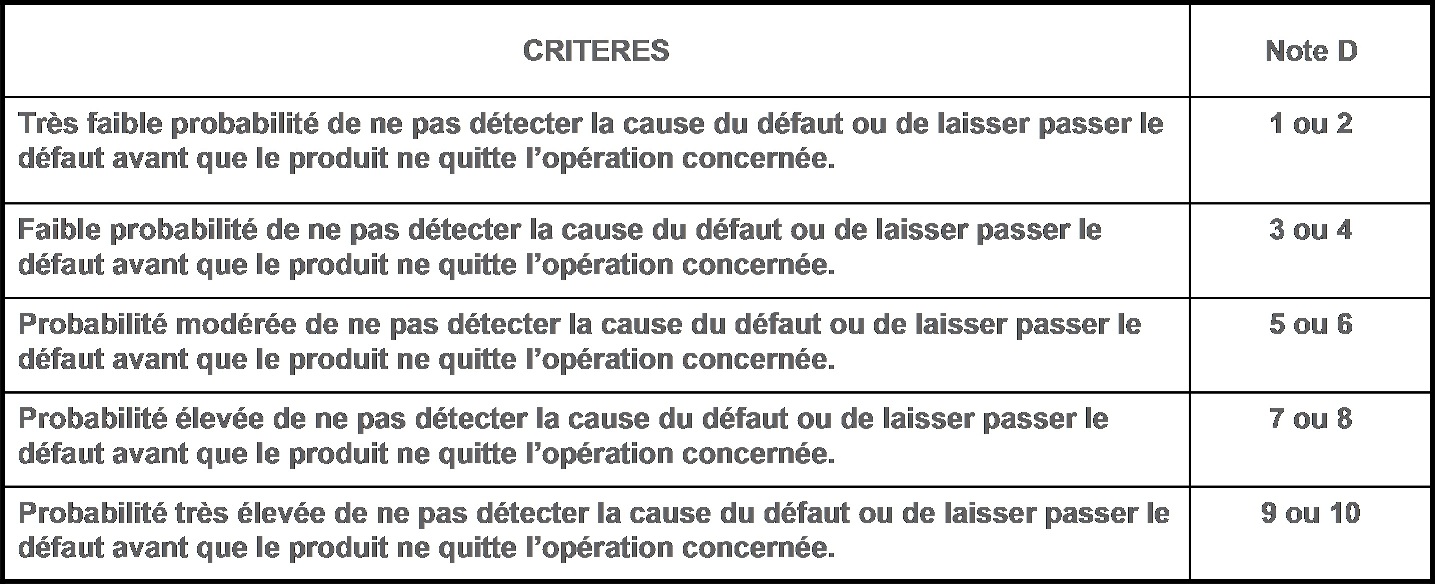
A failure mode is given the ranking 1–10 for assessment of its severity, occurrence and detestability. (See Appendix 5: PFMEA Ranking Reference Tables)
Please refer to Appendix 6: PFMEA Ranking Reference Tables.
After ranking the severity, the occurrence and the detectability, the RPN (Risk Priority Numbers) can be easily calculated by multiplying these three numbers: RPN = O × S × D.
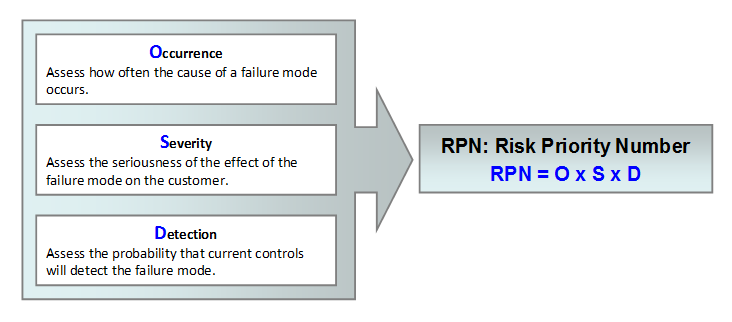
The RPN plays an important part
in the choice of an action against failure modes. They are threshold values in
the evaluation of these actions. The failure modes that have the highest RPN should be given the highest
priority for corrective action. This means it is not always the failure modes
with the highest severity numbers that should be treated first. There could be
less severe failures, but which occur more often and are less detectable.
Once
this is done it is easy to determine the areas of greatest concern. Then we will organize a
meeting with all concerned departments, in order
to recommend actions with
targets, responsibility and dates of implementation. These actions can include
specific inspection, testing or quality procedures…
Step 5: Follow up the action plan and verify
its effectiveness
Once
the actions have been implemented in the process, the new RPN should be
checked, to confirm the improvements. Whenever a process changes, the PFMEA should be updated.
In the section of definition of project, there are
several questions to explain the project objective and expectations. Now, the
result could be explained as well by answers to these questions:
-
What are the key quality problems in year 2010?
From analysis of 2010 quality data of rejects, 3 problems have been highlighted. After reviewed current control measures and evaluated criticality within these three problems. “Pollution of raw material in mixing station” is identified as the key problem.
-
What are root causes of the key problem? Are those causes under control today?
After
investigation and collecting of facts, a root cause diagram have been
constructed, and found out 4 root causes. After evaluation the effectiveness of
current control measures, two causes are still not fully under control today.
-
How to avoid the occurrence of similar quality incidents?
A
reinforce action plan have prepared with responsible departments: labels, logic
diagram, check-list… According last 3 month on site monitoring of production, new
actions have been implemented effectively. Quality result of mixing station is
table.
-
How to improve the quality management system in the manufactory?
From the root causes analysis, we have identified one weakness in current quality management system: Risks identification and prevention are not sufficient before launching new product in the mixing station. We have decided to implement PFMEA method to improve risk analysis and quality control. The implementation has been started from production in mixing station, then to be integrated into quality management system.
Above results approved that the project objective has been reached.
5.2 Lessons Learnt
and
Prospect
Fos
site has never stopped trialing and experimenting to deliver innovation to
support the ambitions of Kerneos.
In
several months, there will another new
product to be lauched in mixing station, how to make sure the successful trial
production? According the lessons and experience we learnt from the project, a
PDCA cycle has been prepared.
There
are 4 phases with different tasks:
PLAN = before production:
>>
develop flow-chart of
production process
>> use PFMEA to analyze
potential failures and prepare control plan
>>
test and check installation and equipments
DO = prevention and control
measure
>> Write
production procedure
>> Write working instruction,
especially for manual operations
>> Put labels on critical
control points in workshops
>>
Train operators
CHECK = during production
>>
Use checklist to follow up critical control points during production
>>
Check the effectiveness of control measures
ACT = after production
>>
Regularly review meeting, re-evaluation
>> Plan of continuous improvement
>>
Follow performance by indicators
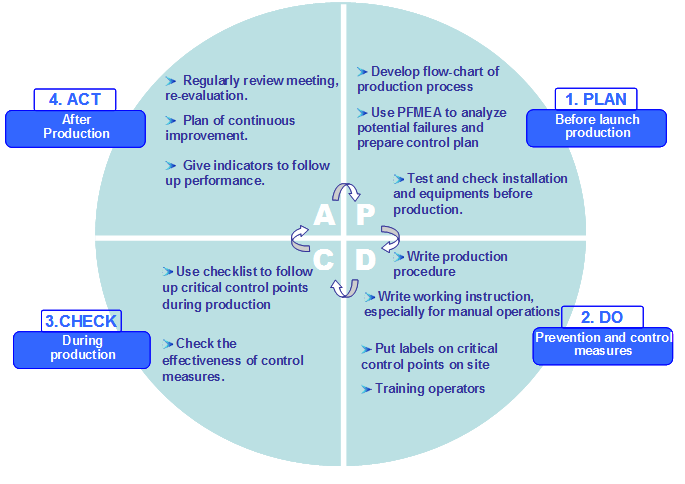
Figure 18: PDCA of improving trial production
We have decided to integrate PFMEA method into current quality management system, to improve risk analysis and quality control. The implementation has been started at the mixing station, in order to be sure of the successful launch of new products. Further more, we’ll apply PFMEA in a larger scope.
The purpose of this
project is to improve the quality performance of Kerneos plant at Fos sur Mer.
This plant is the most important manufactory of Kerneos in France. Its capacity
allows a great flexibility of product ranges, as well as to deliver innovation
to support the ambitions of Kerneos. Trials and changes have brought many
progress, however at the same time, they have caused more rejects produced in
2010.
Fos site quality
management system has been certified by ISO9001 since 1995. The system is well
maintained by “Improve Quality Process”; the laboratory is equipped with modern
automatic instruments; plus high level technical staff. Basing on such good
foundation, it’s a challenge to find out a constructive way to improve quality
performance.
The methodology used
to pilot the project is “7 Steps to solve problems”, combined with “PDCA” and “PFMEA”.
Start from analysis
of quality result in year 2010
à
key quality incidents have been identified
à
then a root causes analysis has been completed, aiming to one critical incident
à
four root causes have been identified
à
after reviewing the effectiveness of current control measures
à
a reinforced action plan has been put in place
à
followed up by monitoring production on site has been done over during 3 months
à
effectiveness is verified by the stable quality performance of mixing station.
à
Risks of the incident are now considered under good control.
From the root causes
analysis, one weakness of existing quality management system has been
identified: Risks Identification and Prevention are not sufficient before
launching new products in the mixing station. PFMEA method has been chosen as
the method, to identify and control potential failure modes of the process. The
application of PFMEA has started at the mixing station, in order to be sure that
the trial production of a new product forecasted in the coming months will be a
success.
The method of PFMEA
is proposed to be integrated into the existing quality management system for
continuous improvement.
This project report will be communicated within Kerneos industrial sites in order to learn lessons and share good practices of improving quality performance.
[1] 1908-2008 The Aluminates Pioneers From Cement Fondu to Kerneos, Kerneos, version 2008.
[2] Manual for the management of quality health and safety at work. MAQ-S001G, Révsion21, Kerneos Siege
[3] Tour de mélange Interface homme/machine Manuel Utilisateur, Révision 14-12-2009, Kerneos Usine Fos sur Mer
[4] Procédure DEMARRAGE STATION DE MELANGE, Révision 17-02-2011, Kerneos Usine Fos sur Mer
[5] Kerneos Web, available online http://www.kerneos.com (05-06-2011)
[6] Fondements méthodologiques de l’amélioration continue et de la résolution des problèmes, UTC, Master Management Qualité © 2010 G. Farges, available online https://www.utc.fr/master-qualite (15-03-2011)
[7] AMDEC & Arbre de Défaillance - Assurer et manager la confiance face au risque, 2010 J.Escande, available online https://www.utc.fr/master-qualite (20-03-2011)
[8] PDCA, available online http://en.wikipedia.org/wiki/PDCA (03-05-2011)
[9] Root cause analysis, available online http://www.thinkreliabilicom/Root-Cause-Analysis-CM-Basics.aspx (15-04-2011)
[10] FMEA, available online http://www.siliconfareast.com/fmea.htm (05-05-2011)
[11] FMEA, available online http://en.wikipedia.org/wiki/Failure_mode_and_effects_analysis (10-05-2011)
[12] PFMEA, available online http://www.qualitytrainingportal.com/resources/fmea/ (05-05-2011)
[13] Techniques d'analyses de la fiabilité du système – Procédure d'analyse des modes de défaillance et de leurs effets (AMDE), Norme NF EN 60812 Août 2006
Appendix 1 : Kerneos process in the plant [2]
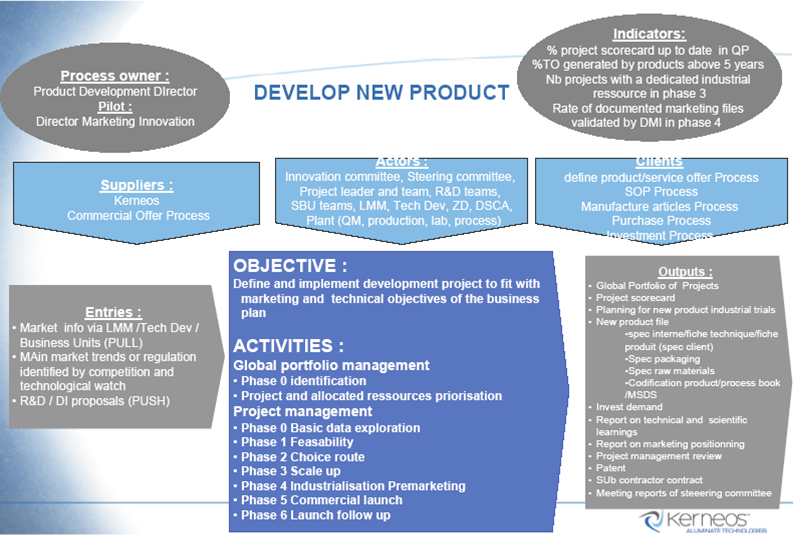
Appendix 2: Develop new product process
Appendix 3: Root Causes Analysis Diagram
Appendix 4: Checklist of Transfer RM P
![]()
Appendix 5: Logic diagram of Production Process in Mixing Station
Appendix 6: PFMEA Ranking Reference Tables
Occurrence Ranking
Severity Ranking
Detectability Ranking
Analyse de Livraison des Combustibles
et des Certificats de Qualité
1. Location : l’Usine Fos sur Mer
2. Période : novembre 2010 – février 2011
3. Fournisseurs des combustibles:
4. Analyse des Certificats de Qualité des Fournisseurs
Bilan

Détail
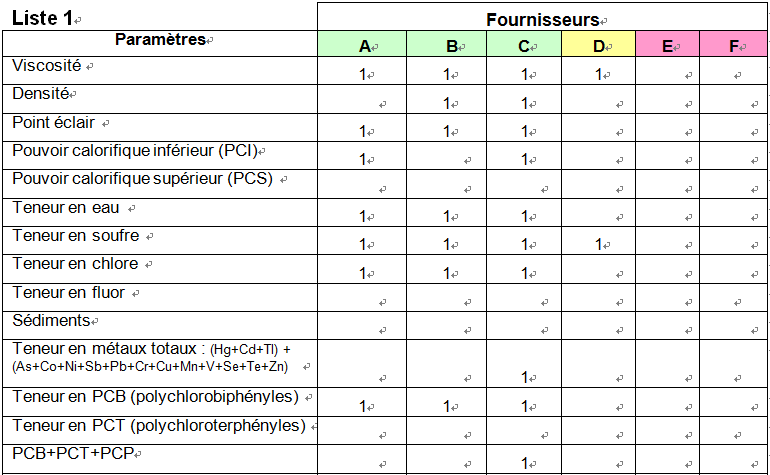
5. Besoins de l’usine Fos sur Mer :
Paramètres d’Environnement : Tous les paramètres dans la Liste 1
Paramètres de Qualité et Sécurité : Viscosité, Point éclaire, PCI, Teneur en eau, Teneur en soufre, Na et K.
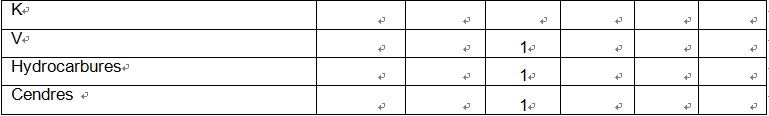
Les Paramètres dans le Certificat de Qualité :
Une fois par mois par produit : Tous les paramètres dans la Liste 1
- avec garantie par le fournisseur de produit stable.
Chaque camion : un Certificat de Qualité avec les paramètres dans la Liste 2
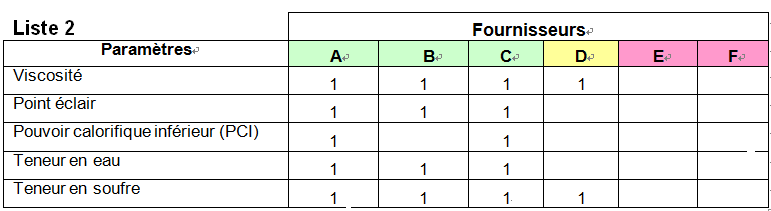
Remarque : les cellules vides sont les informations manquantes des fournisseurs