Name
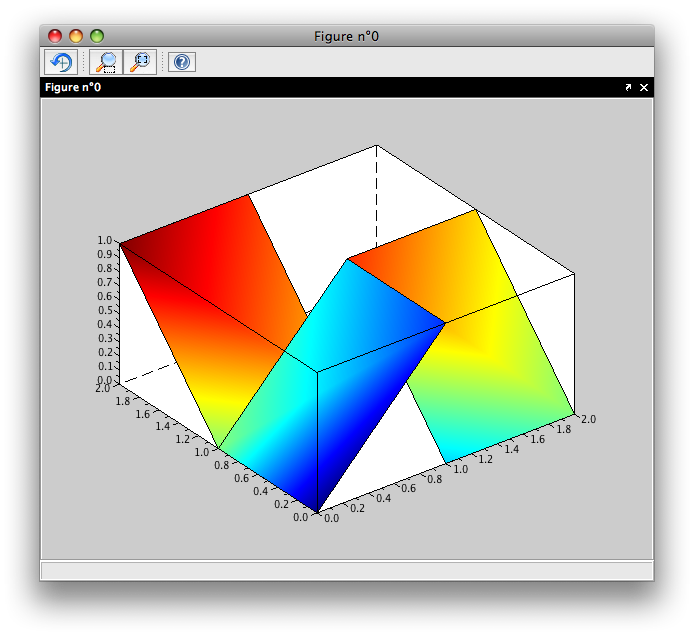
fill3 — Display 3-D filled polygons with pseudo-color
Calling Sequence
hdl = fill3(X,Y,Z,C)
Parameter
- X
-
m by n matrix
- Y
-
m by n matrix
- Z
-
m by n matrix
- C
-
1 by n matrix or m by n matrix
- hdl
-
Handle of the created Fac3d entity
Description
fill3(X,Y,Z,C) displays 3D filled m-vertices polygons. When C is a vector then C(i) gives the value for polygon i. The actual color is computed by mapping the minimum and maximum value of C to the RBG colormap of the current figure. The actual scale can be controlled by the 'caxis' property.
When X,Y,Z and C are matrices of the same size, the color is given by the first vertex of each polygon or interpolated, depending on the 'shading' property.