Name
surf — Display 3-D color surface
Calling Sequence
hdl = surf(X,Y,Z,C)
Parameter
- X
-
1 by m matrix or n by m matrix
- Y
-
1 by n matrix or n by m matrix
- Z
-
n by m matrix
- C
-
n by m matrix
- hdl
-
Handle of the created Fac3d entity
Description
surf(x,y,Z,C) plots the colored parametric or non parametric surface defined by four arguments. The view point is specified by the 'view' proporty (see below).
surf(X,Y,Z) uses C = Z, so color is proportional to surface height.
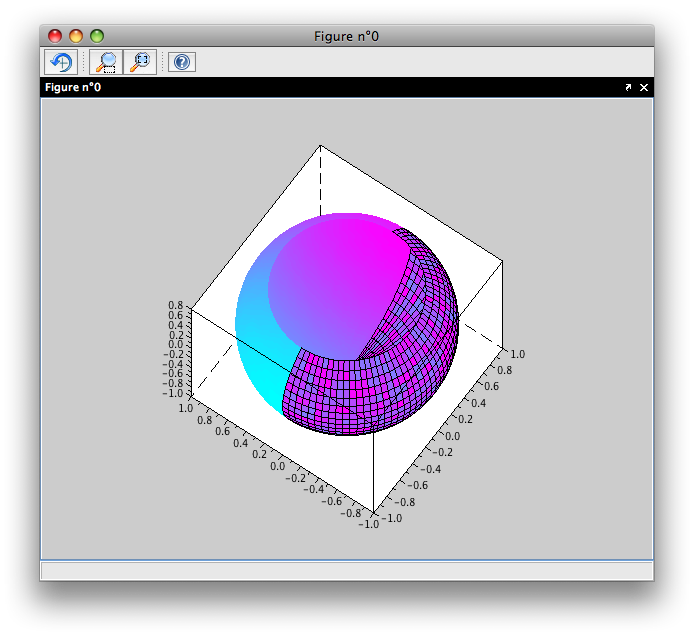
The entries of C are scaled to correspond to the current colormap entries.The color of edges is given by the default foreground and can be changed by the properties 'edgecolor' . The color of faces is flat by default or interpolated. Use the 'facecolor' property (see examples below). The actual mapping of C values to colors depends on the colormap and the color axis (see colormap, caxis).
When x,y and Z are matrices of the same size, surf(x,y,Z) plots the parametric surface defined by vertices (x(i,j), y(i,j), Z(i,j)).
When x,y are vector arguments you must have length(x) = n and length(y) = m where [m,n] = size(Z).In this case, the vertices of the surface lines are the triples (x(j), y(i), Z(i,j)). Note that x corresponds to the columns of Z and y corresponds to the rows, example :
x=linspace(-1,1,20); y=linspace(-2,2,40);
Z=cos(y'*x);
surf(x,y,Z);
Note that surf(Z) uses x = 1:m and y = 1:n
