Name
plot3 — Plot lines and points in 3-D space.
Calling Sequence
hdl = plot3(X,Y,Z)
Parameters
- X
-
1 by n or m by n matrix
- Y
-
1 by n or m by n matrix
- Z
-
1 by n or m by n matrix
- hdl
-
Handle of the created Polyline entity
Description
plot3() is a three-dimensional analogue of PLOT().
plot3(x,y,z), where x, y and z are three vectors of the same length, plots a line in 3-space through the points whose coordinates are the elements of x, y and z. plot3(X,Y,Z), where X, Y and Z are three matrices of the same size, plots several lines obtained from the columns of X, Y and Z.
Various line types, plot symbols and colors may be obtained with plot3(X,Y,Z,s) where s is a 1, 2 or 3 character string made from the characters listed under the PLOT command. plot3(x1,y1,z1,s1,x2,y2,z2,s2,x3,y3,z3,s3,...) combines the plots defined by the (x,y,z,s) fourtuples, where the x's, y's and z's are vectors or matrices and the s's are strings.
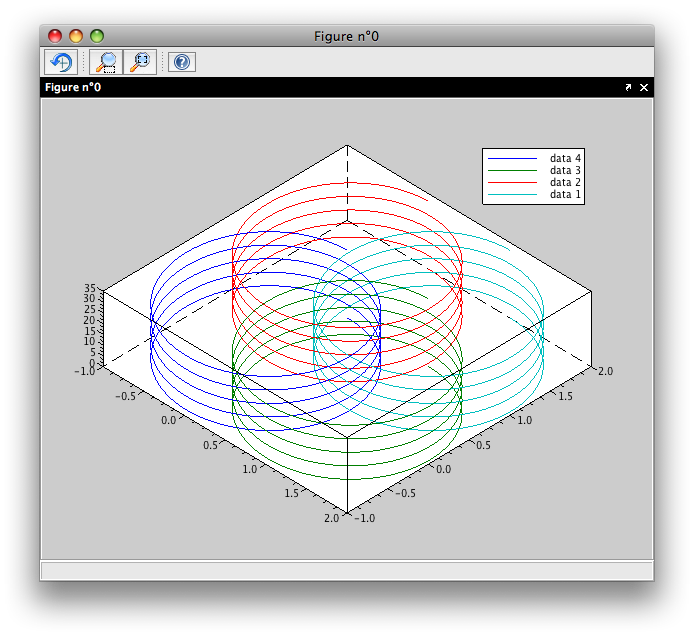
Example: A helix
t = 0:%pi/50:10*%pi;
plot3(sin(t),cos(t),t);
The X,Y,Z triples, or X,Y,Z,S quads, can be followed by parameter/value pairs to specify additional properties.