Name
plot — linear 2D plot
Calling Sequence
hdl = plot(X,Y,...,'PropertyName',PropertyValue,...)
hdl = plot(ax,X,Y,...)
Parameters
- X
-
1 by n or m by n matrix
- Y
-
1 by n or m by n matrix
- ax
-
Axes handle
- hdl
-
Handle of the created Polyline entity
Description
plot(X,Y) plots vector Y versus vector X. If X or Y is a matrix, then the vector is plotted versus the rows or columns of the matrix, whichever line up.
plot(Y) plots the columns of Y versus their index. In all uses of plot, the imaginary part is ignored.
Various line thickness/style, plot symbols or colors may be obtained with plot(X,Y,S) where S is a character string made from one element from any or all the following 3 colunms
| y : yellow | . point | - : solid |
| m : magenta | o circle | -- : dashed |
| c : cyan | + plus | -. : dash-dot |
| r : red | * star | 2 : double thickness |
| g : green | d diamond | 3 : triple thickness |
| b : blue | f filled diamond | ... up to 9 times |
| w : white | t trefoil | |
| b : black | ^ triangle up | |
| v triangle down |
For example, plot(X,Y,'-c+') plots a cyan solid line with a plus at each data point; plot(X,Y,'bd') plots blue diamond at each data point but does not draw any line.
plot(X1,Y1,S1,X2,Y2,S2,X3,Y3,S3,...) combines the plots defined by the (X,Y,S) triples, where the X's and Y's are vectors or matrices and the S's are strings. For example, plot(X,Y,'y-',X,Y,'go') plots the data twice, with a solid yellow line interpolating green circles at the data points.
The plot command, if no color is specified, makes automatic use of the colors.
When f is a function then plot(x,f) plots the parametric or non parametric curve defined by f :
-
If f has the syntax [y]=f(x) then plot(x,f) plots the non-parametric y=f(x),
-
If f has the syntax [x,y]=f(t) then plot(t,f) plots the parametric curve [x(t),y(t)], example :
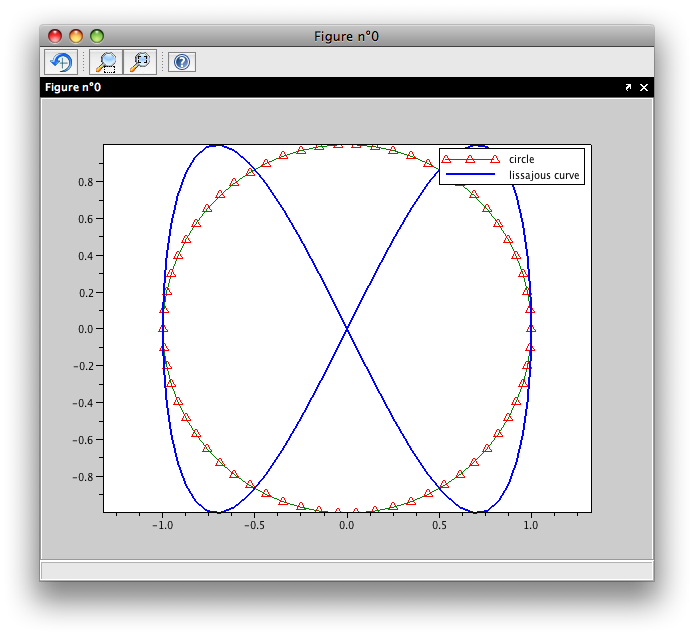
t=linspace(0,2*%pi,63);
plot(cos(t),sin(t),'-g^r',cos(t),sin(2*t),'thickness',2);
axis equal
legend 'circle' 'lissajous curve'
The X,Y pairs, or X,Y,S triples, can be followed by parameter/value pairs to specify additional properties of the plot.