Name
pcolor — Pseudo color 2-D plot
Calling Sequence
hdl = pcolor(X,Y,C)
Parameter
- X
-
1 by n matrix or n by n matrix
- Y
-
1 by n matrix or n by n matrix
- C
-
n by n matrix
- hdl
-
Handle of the created Fac3d entity
Description
pcolor(x,y,C) plots the colored rectangular or non rectangular 2D patches defined by three arguments
The axis labels are determined by the range of X, Y or by a 'axis' property setting. The color of the patch is determined by the matrix C. The entries of C are scaled to correspond to the current colormap entries (see caxis and colormap).
When x,y and C are matrices of the same size, pcolor(x,y,C) plots the colored patches of vertices (x(i,j), y(i,j)) and color C(i,j).
When x,y are vector arguments you must have length(x) = n and length(y) = m where [m,n] = size(C).In this case, the vertices of the (rectangular) patches are the couples (x(j), y(i)). Note that x corresponds to the columns of C and y corresponds to the rows. Example :
x=linspace(-1,1,20); y=linspace(-2,2,40);
Z=cos(y'*x);
pcolor(x,y,Z);
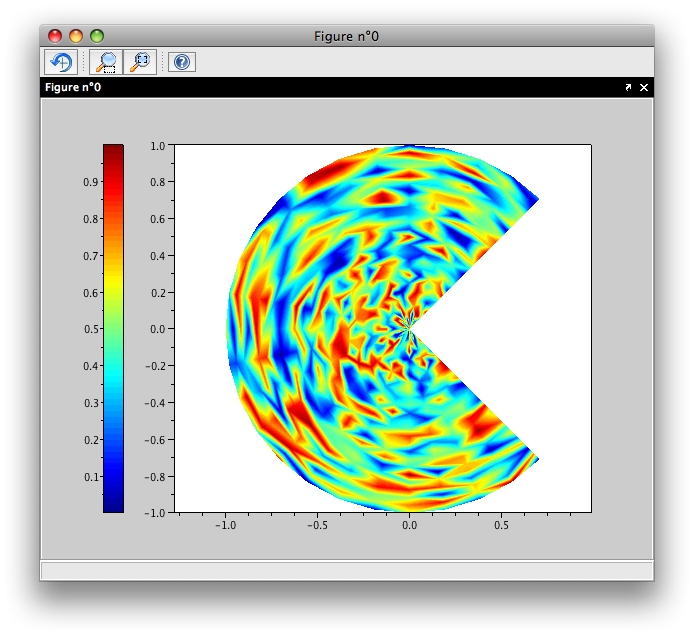
r=linspace(0,1,25);
theta=%pi/4+linspace(0,3*%pi/2,25);
[R,T]=meshgrid(r,theta);
pcolor(R.*cos(T),R.*sin(T),exp(-2*R.^2),'shading','interp','colorbar','on','axis','equal')
Note that surf(Z) uses x = 1:n and y = 1:m. When f is a function/macro and x,y are vectors, pcolor(x,y,f) produces a 2D plot corresponding to a parametric or non parametric surface defined by f :
-
if Z has the syntax z=f(x,y) then pcolor(x,y,f) plots a 2D view of a non parametric surface,
-
if Z has the syntax [x,y,z]=f(u,v), then pcolor(u,v,f) plots a 2D view of a parametric surface,
-
pcolor(x,y,f,g), when g has the syntax g=f(x,y), uses the color given by g to determine the color of faces.