Name
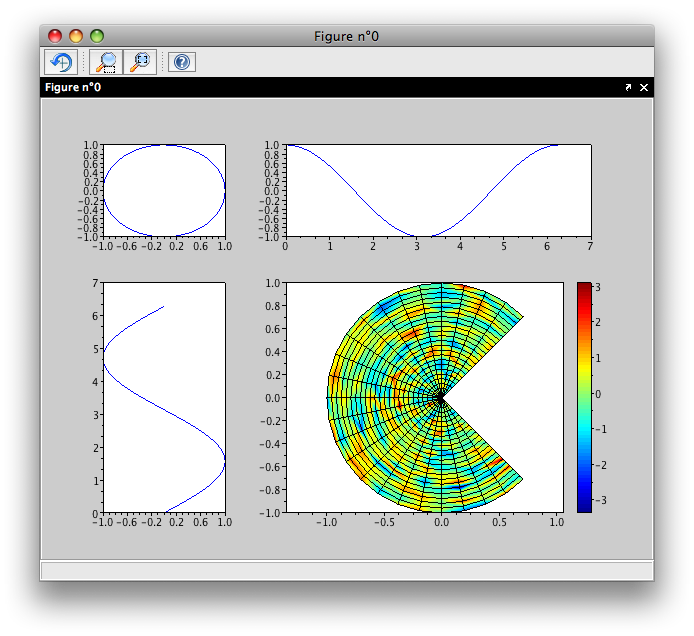
subplot — divides the current figure into rectangular panes
Calling Sequence
ax=subplot(n,m,p)
subplot(nmp)
Parameters
- n
-
number of rows
- m
-
number of cols
- p
-
vector of pane numbers
- ax
-
Handle of the created axes.
Description
The subplot divides the current figure into rectangular panes numbered row-wise. The parameter p gives the number of the pane, and if p is a vector then the smallest rectangle enclosing the corresponding panes is created. If another axes already exists at the same position then it becomes the current axes but if the newly created axes overlaps existing axes then the latter are destroyed.