Name
plotyy — 2-D line plots with y-axes on both left and right side
Calling Sequence
[ax,h1,h2] = plotyy(x1,y1,x2,y2)
[ax,h1,h2] = plotyy(x1,y1,x2,y2,fun)
[ax,h1,h2] = plotyy(x1,y1,x2,y2,fun1,fun2)
Parameters
- x1,y1
-
Compatible vectors or matrices
- x2,y2
-
Compatible vectors or matrices
- fun,fun1,fun2
-
string
- ax
-
vector of axes handles
- h1,h2
-
Polyline handles
Description
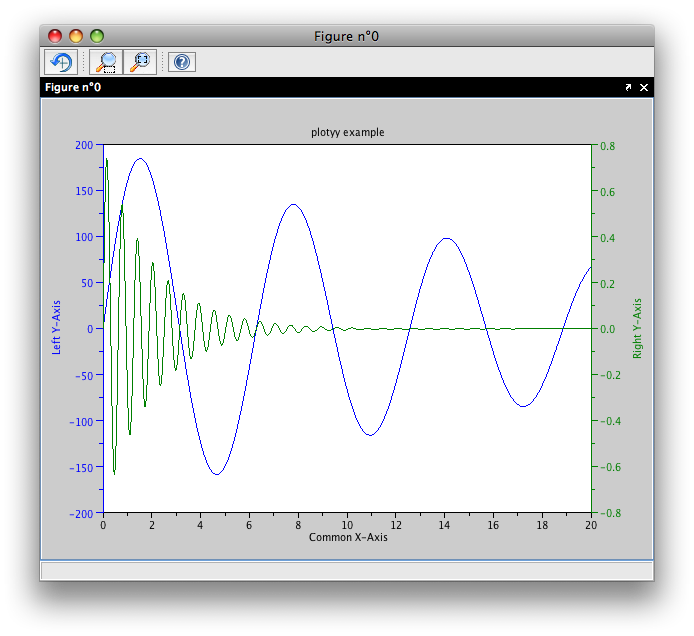
[ax,h1,h2]=plotyy(x1,y1,x2,y2) plots y1 versus x1 with y axis on the left and y2 versus x2 with y axis on the right. This function uses stacked axes whose handles are given by ax(1) and ax(2). The polylines with handles h1 and h2 are respective children of ax(1) and ax(2). The third component ax(3) with default color is used to display the common x-axis and the title.
The optional string fun allows to specify the plotting function. Use fun1 and fun2 if a different function is to be used for (x1,y1) and (x2,y2). The default value is "plot".