Name
quiver — 2D vector field plot
Calling Sequence
hdl = quiver(X,Y,U,V,fact)
Parameter
- X
-
1 by n matrix or n by n matrix
- Y
-
1 by n matrix or n by n matrix
- U
-
n by n matrix
- V
-
n by n matrix
- fact
-
scalar
- hdl
-
Handle of the created Fac3d entity
Description
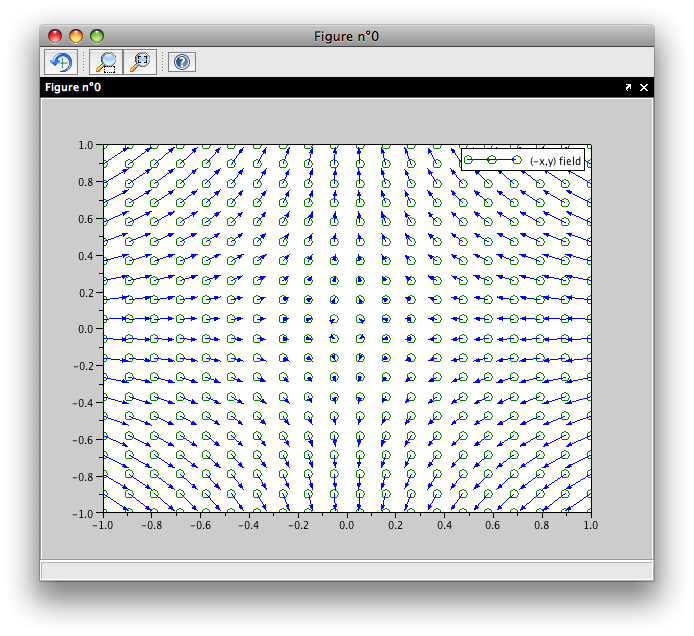
quiver(X,Y,U,V) plots vector field with cartesian coordinaes (U,V) defined on a parametric or non parametric mesh defined by (X,Y) (see e.g. surf for a discussion about the relative sizes of X and Y). The vectors are automatically scaled to fit in the grid defined by X and Y.
The last argument 'fact' is a scale factor for the vectors, if you want to change the length of vectors. If you don't want any scaling at all, use fact=0.